The Infrared Spectra of Polymers, VII: Polymers with Carbonyl (C=O) Bonds
We continue our survey of the infrared (IR) spectra of polymers with a look at the spectra of polymers that contain carbonyl or C=O bonds. Our long-term goal is to examine the spectra of polymers that contain ketone, carboxylic acid, ester, and carbonate linkages. Studying these spectra is vital, because these molecules are important economically and are ubiquitous in society.
We begin this installmentwith a discussion of the unique bonding of the carbonyl functional group and how that impacts their infrared (IR) spectra. We then review the structures and spectra of ketones, and examine an example spectrum of a polymer with a ketone linkage in it.
Review of C=O Bonding and Spectroscopy
A carbon–oxygen double bond is referred to as a carbonyl bond. The structure of this bond is seen in Figure 1. As shown in Figure 1, the carbon in this bond is called the “carbonyl carbon.”
Figure 1: The chemical structure and charge distribution in a carbonyl bond.
Carbonyl bonds are highly polar because of the large electronegativity difference between carbon and oxygen. As a result, the carbonyl carbon has a large partial positive charge, and the oxygen has a large partial negative charge as denoted by the small Greek letter deltas in Figure 1. Recall that when in a chemical bond there are two charges separated by a distance, it forms what is called a dipole moment (1). Additionally, remember that the change in a dipole moment with respect to bond length, dµ/dx, during a molecular vibration is one of the things that determines the IR intensity (1).
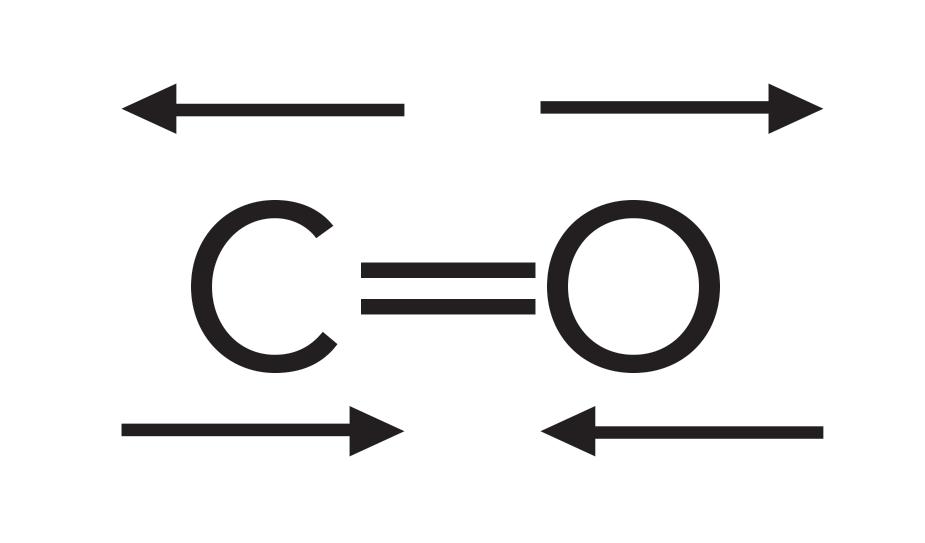
Because the carbonyl group has a large dipole moment, when this group stretches and contracts, the value of dµ/dx is large, which results in an intense peak. The C=O stretching vibration is illustrated in Figure 2.
Figure 2: The stretching vibration of a carbonyl bond.
Carbonyl stretching peaks generally fall between 1900 and 1600 cm-1 (assume all peak positions hereafter are in wavenumber units), a relatively unique part of the IR spectrum. This area is sometimes referred to as the “carbonyl stretching region.” The carbonyl stretching peak is perhaps the perfect example of a group wavenumber, which is a peak that shows up intensely in a unique and relatively narrow wavenumber range. This makes C=O stretches one of the easiest IR peaks to spot and assign. Therefore, an IR spectrometer is, in some respects, the perfect carbonyl detector.
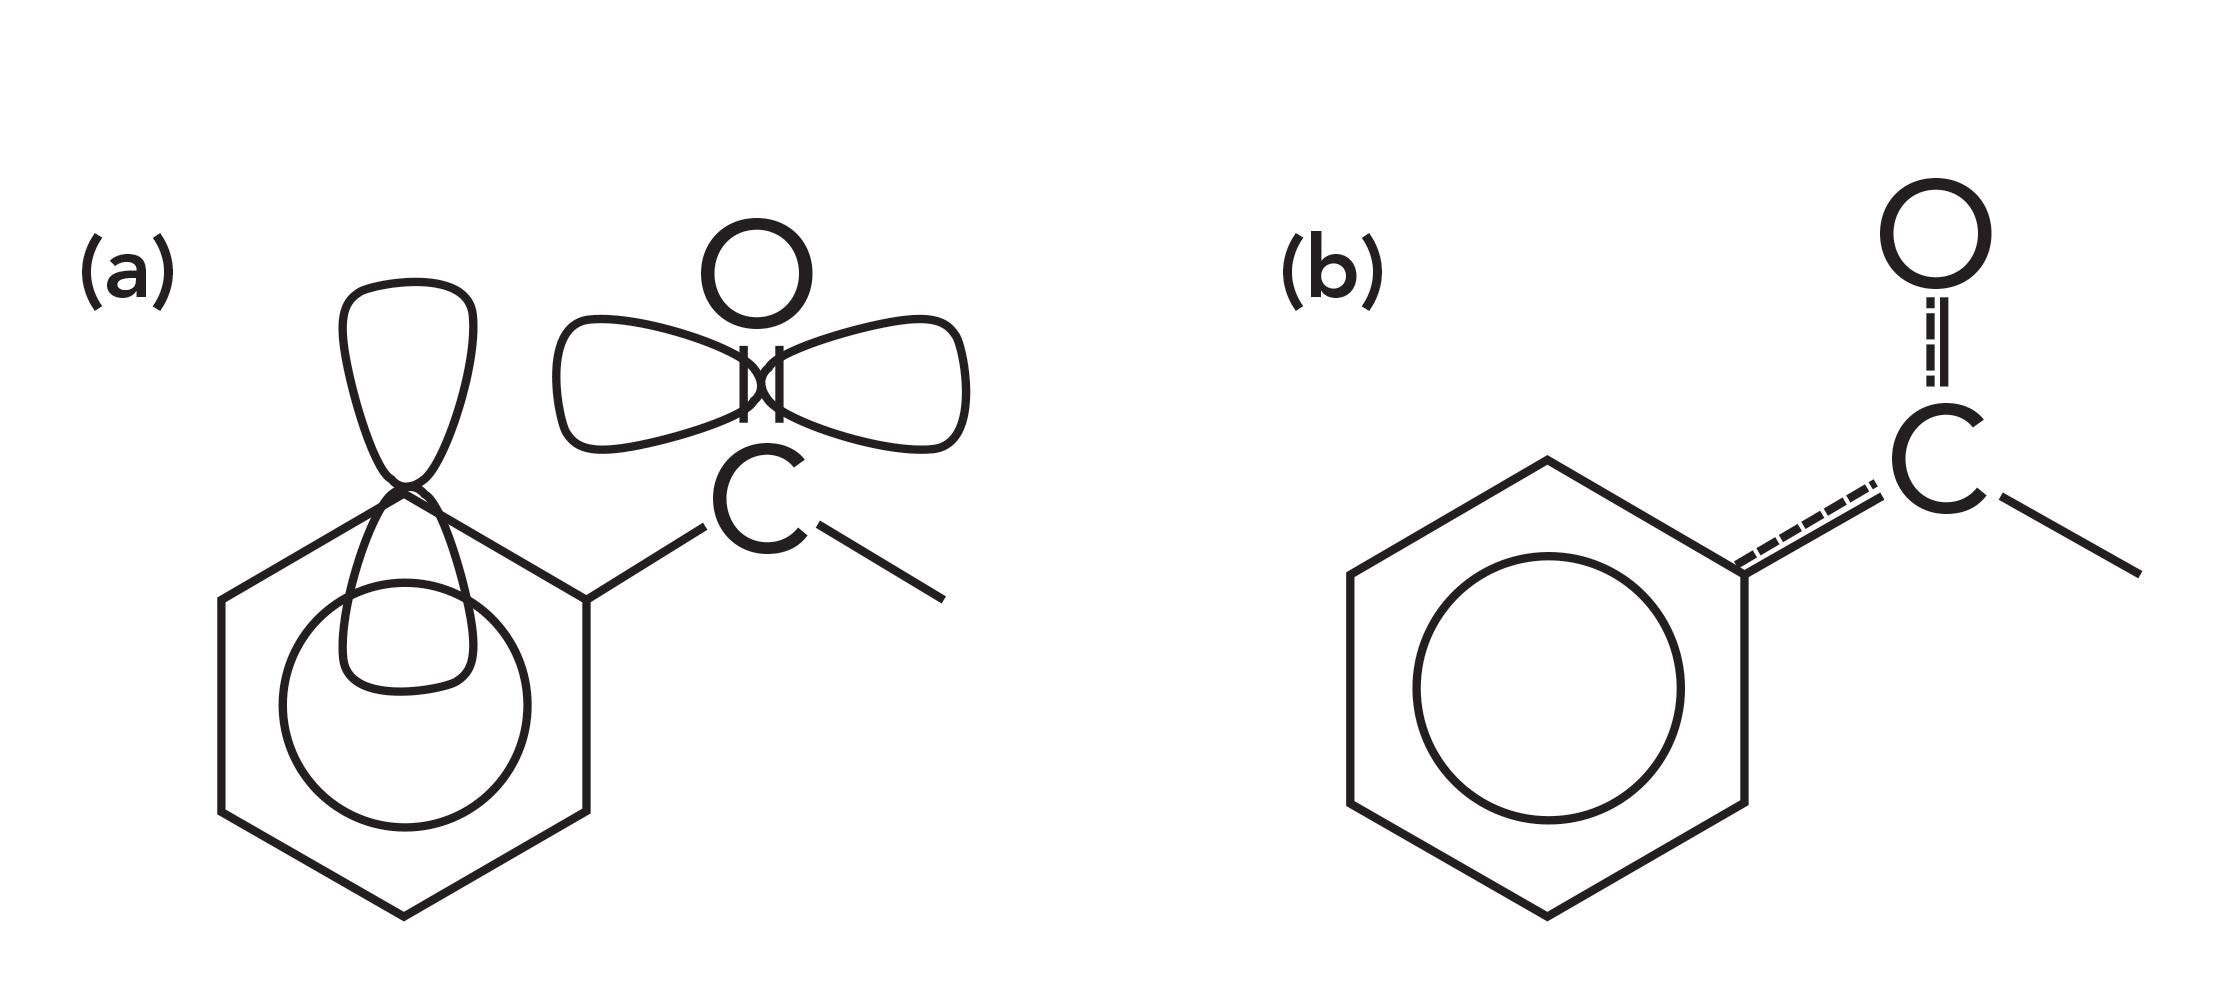
Carbonyl bonds can be divided into two classes depending on what type of carbons are attached to the carbonyl carbon. A saturated carbonyl group has two saturated carbons attached to the carbonyl carbon. An aromatic carbonyl group has one or more aromatic carbons attached to the carbonyl carbon. Examples of an aromatic carbonyl group and its bonding is seen in Figure 3 (please pardon the diagram; it is hard to depict three-dimensional [3D] molecular orbitals in two dimensions).
Figure 3: (a) The p-type orbitals and (b) conjugation within an aromatic carbonyl group.

Recall that when we introduced aromatic rings (2), we showed that some of the electrons in a benzene ring delocalize to form a cloud of electron density called a pi cloud, and the electrons in this cloud are called pi electrons, which are illustrated in Figure 4.
Figure 4: (a) The p orbitals on each of the six carbon atoms in benzene that each contribute an electron to the ring. (b) The collection of delocalized P orbital electrons that form a pi cloud of pi electron density above and below the plane of the benzene ring.
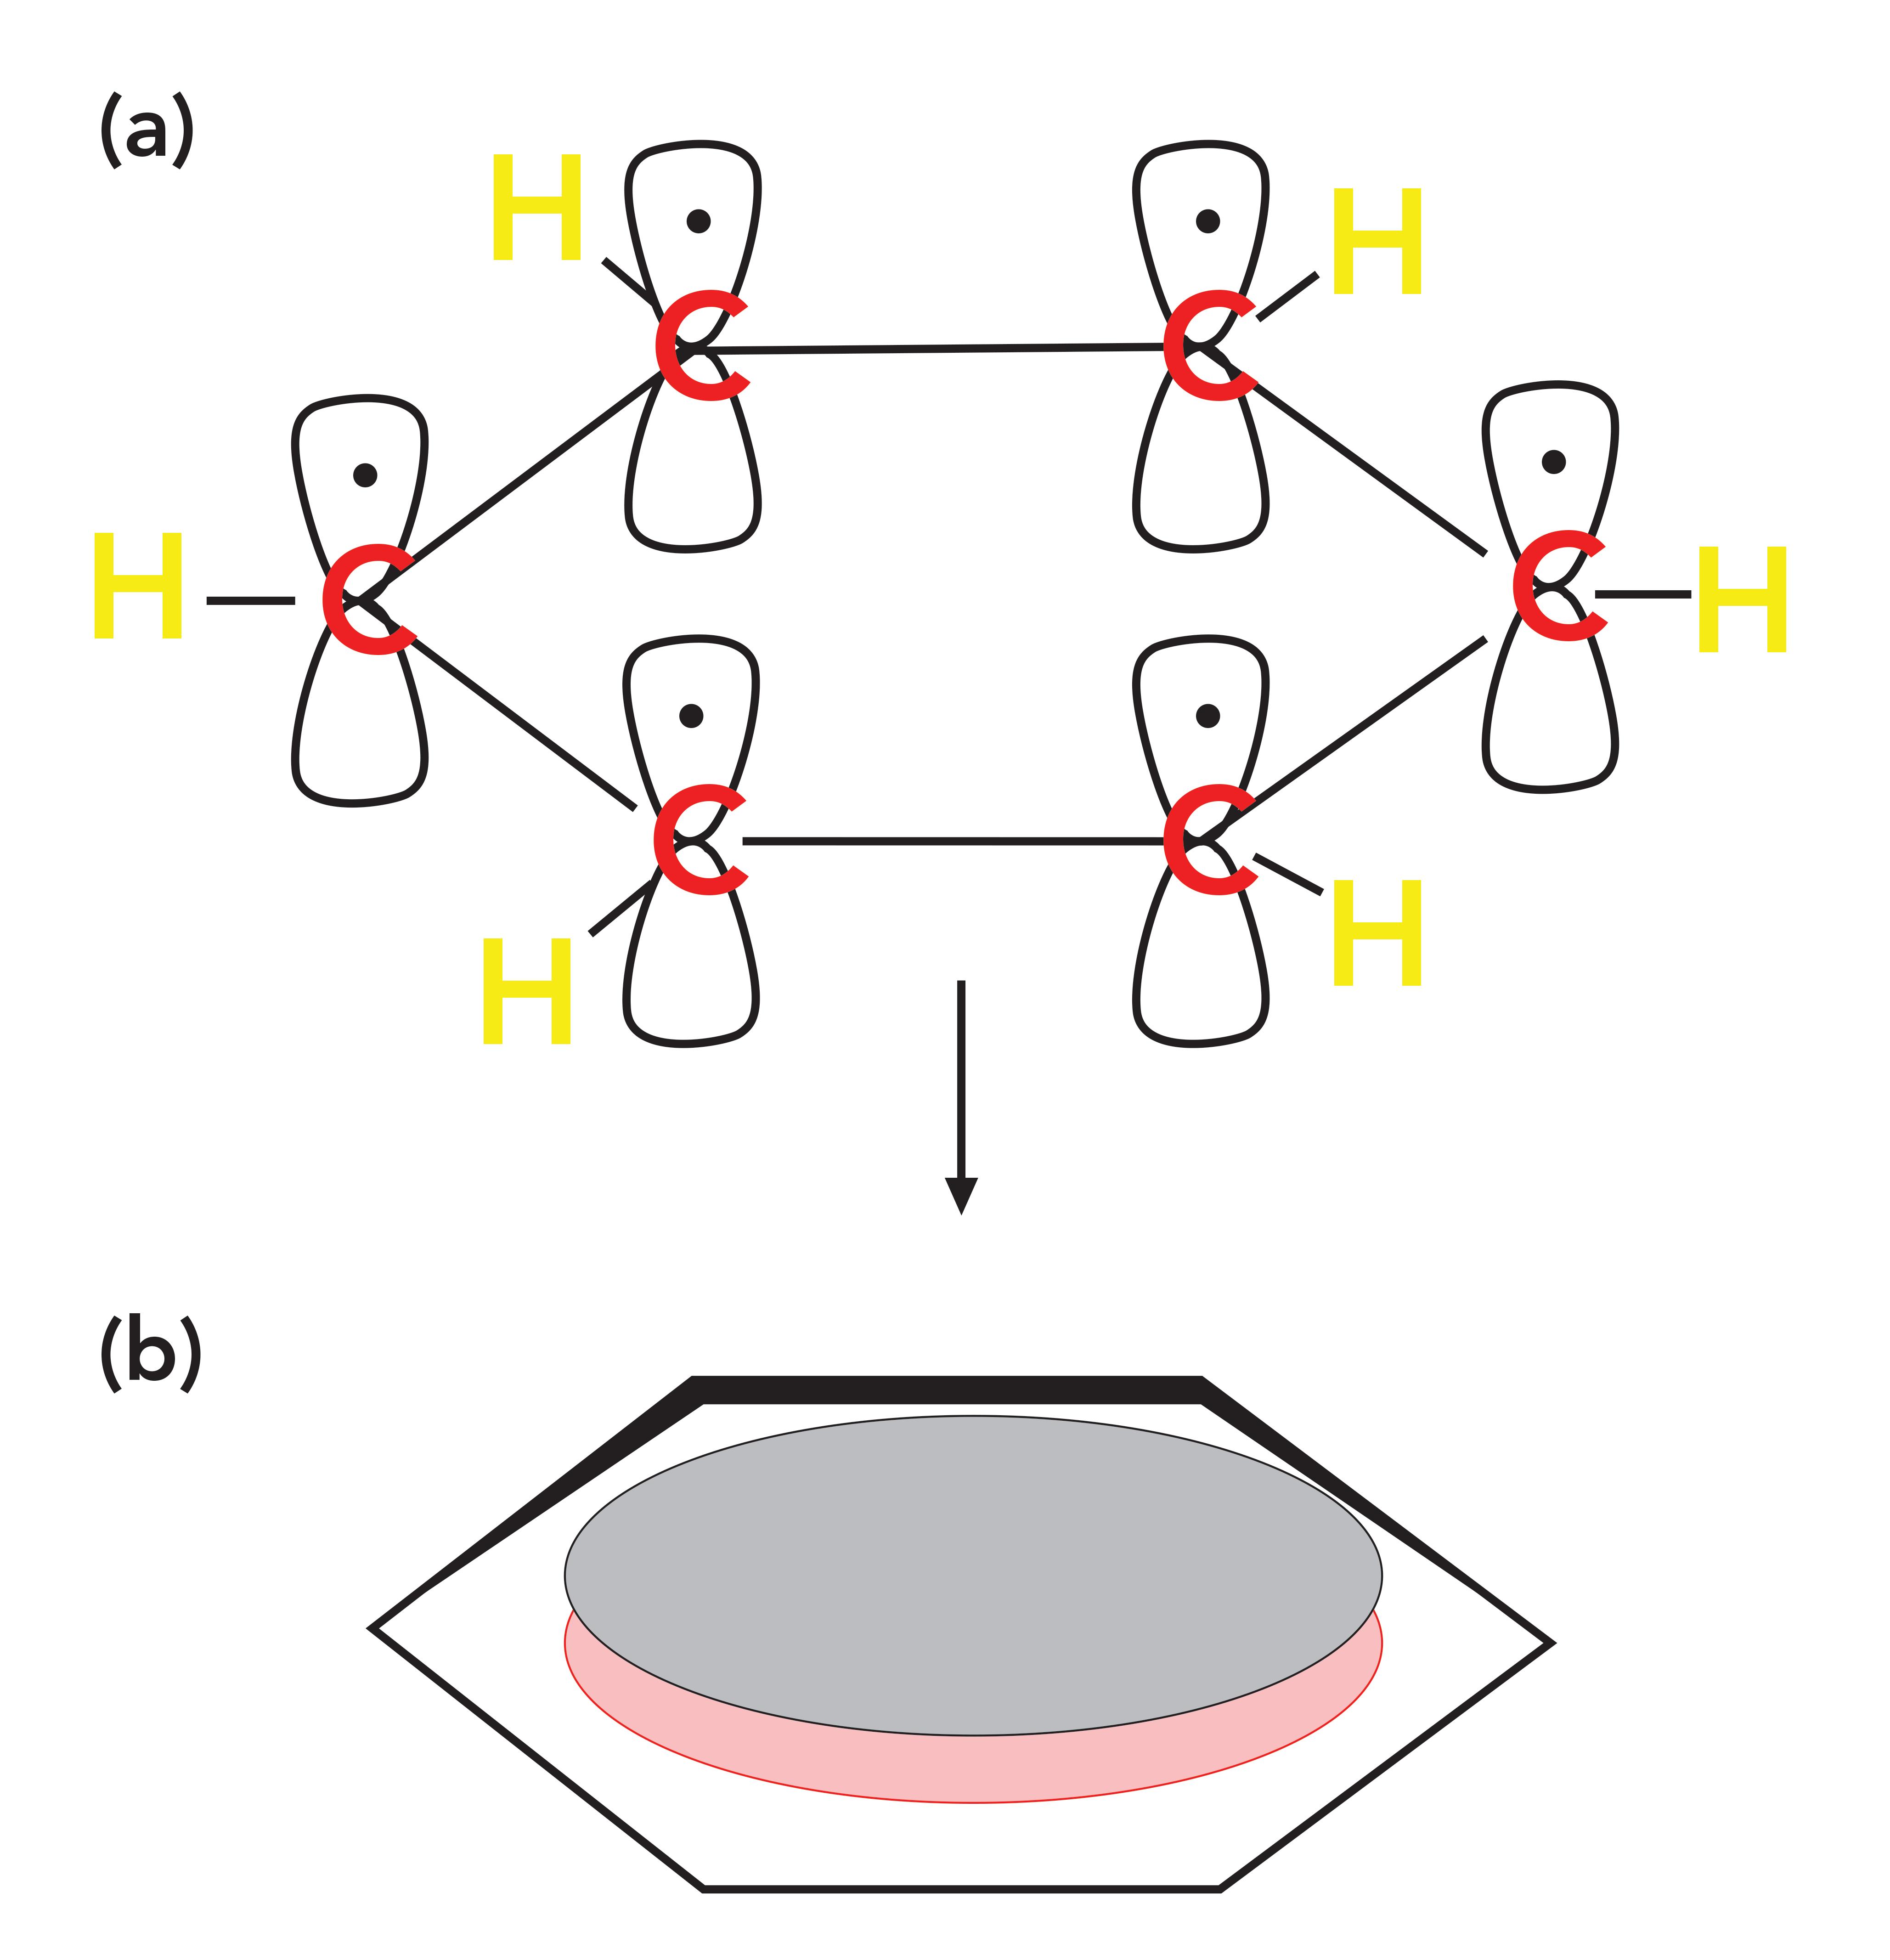
Aromatic rings, such as benzene, contain p-type orbitals with electron density in them, and these orbitals stick up out of the plane of the molecule as illustrated at the top of Figure 4. The carbonyl group also contains a p-type orbital that points through space towards the orbitals on the aromatic ring as illustrated in Figure 3. The second carbon-oxygen bond in a carbonyl group has significant electron density perpendicular to the C=O bond axis forming what is also called a pi bond with pi electrons in it.
On the left side of Figure 3, you can see that the pi bond of the C=O group points in space towards the pi electron cloud of the benzene ring. Because of the proximity of these two pi electron clouds, there is some orbital overlap and, as a result, some of the electron density is siphoned off from the C=O bond into the benzene ring, which is illustrated by the dashed lines to the right in Figure 3. This phenomenon, whereby electrons are pulled from part of a molecule, is called conjugation. Conjugation weakens the C=O bond, lowers its force constant, and lowers its peak position compared to if there were only saturated carbons attached to the benzene ring.
Figure 5 shows the spectrum of acetone. Acetone has two saturated carbons bonded to the carbonyl carbon; hence, no conjugation takes place. Note that its C=O stretching peak falls at 1716 and is labeled A. It is also important to note how intense this peak is; carbonyl stretches are some of the strongest IR features you will ever see.
Figure 5: The IR spectrum of acetone, C3H6O.
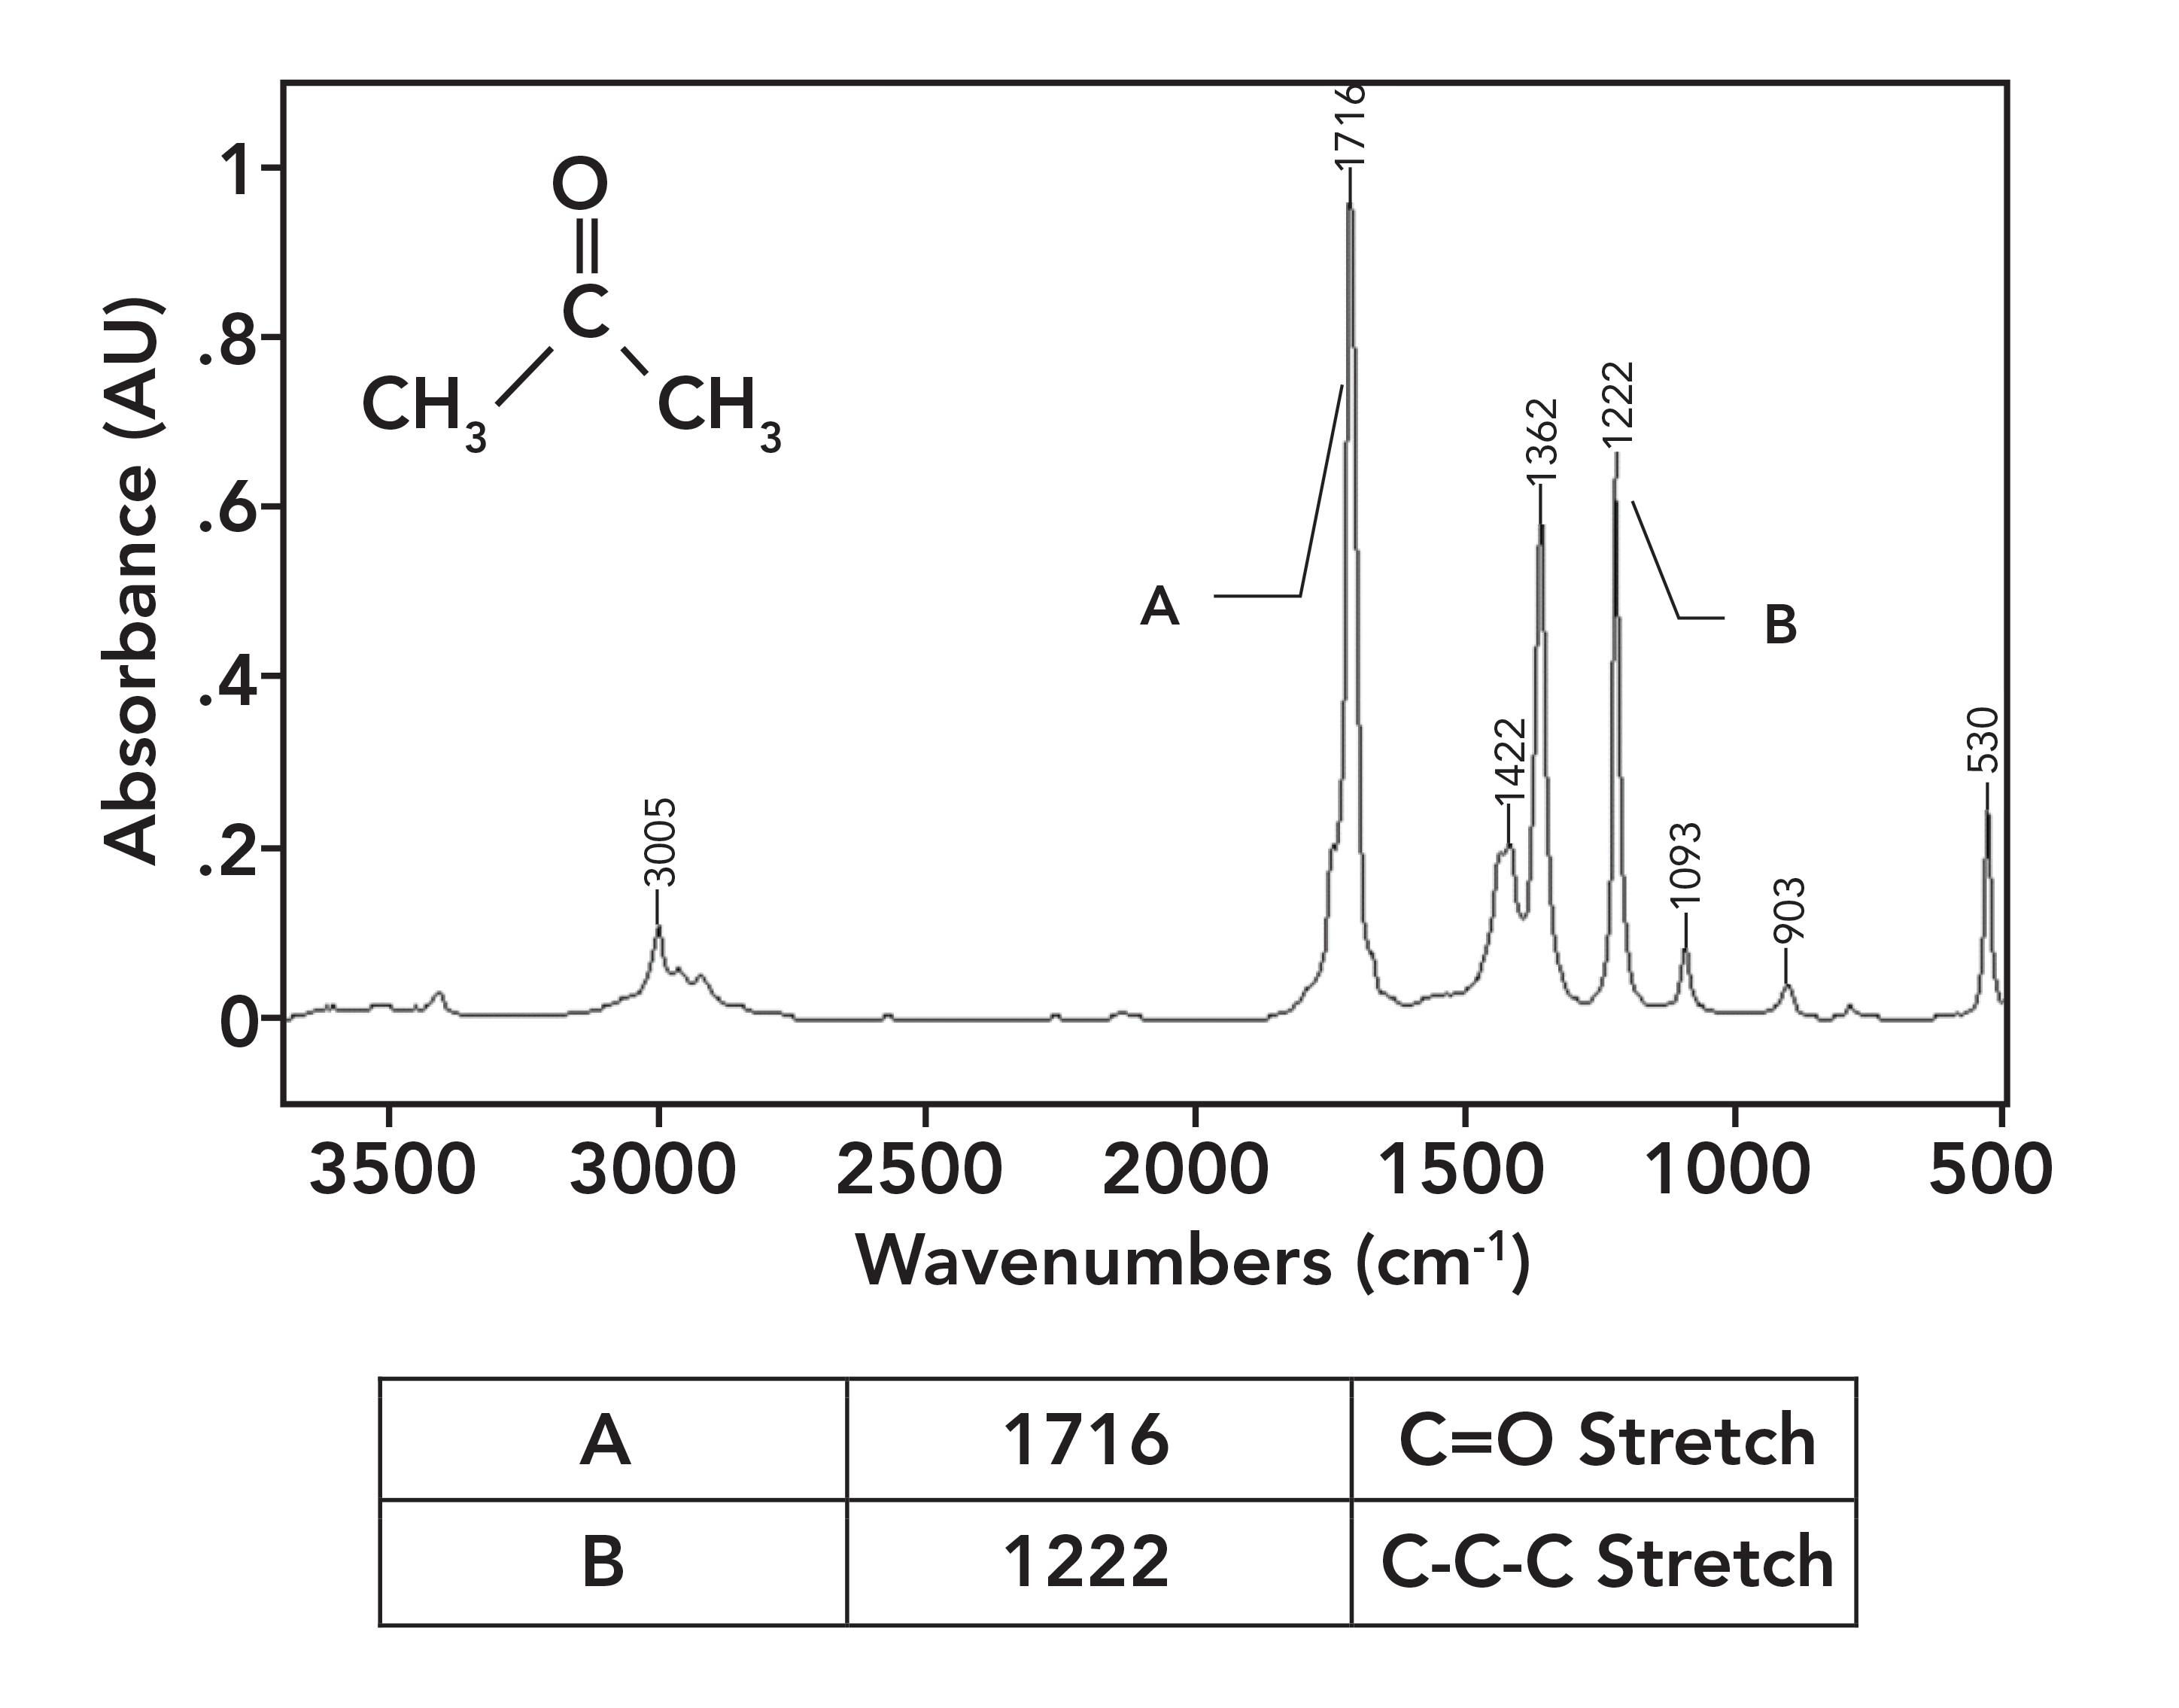
Figure 6 shows the spectrum of acetophenone, which has an aromatic ring bonded to the carbonyl carbon; therefore, its C=O bond is conjugated. As a result, its C=O stretch is at 1686, 30 cm-1 lower than in acetone.
Figure 6: The IR spectrum of acetophenone (phenyl methyl ketone), C6H8O.
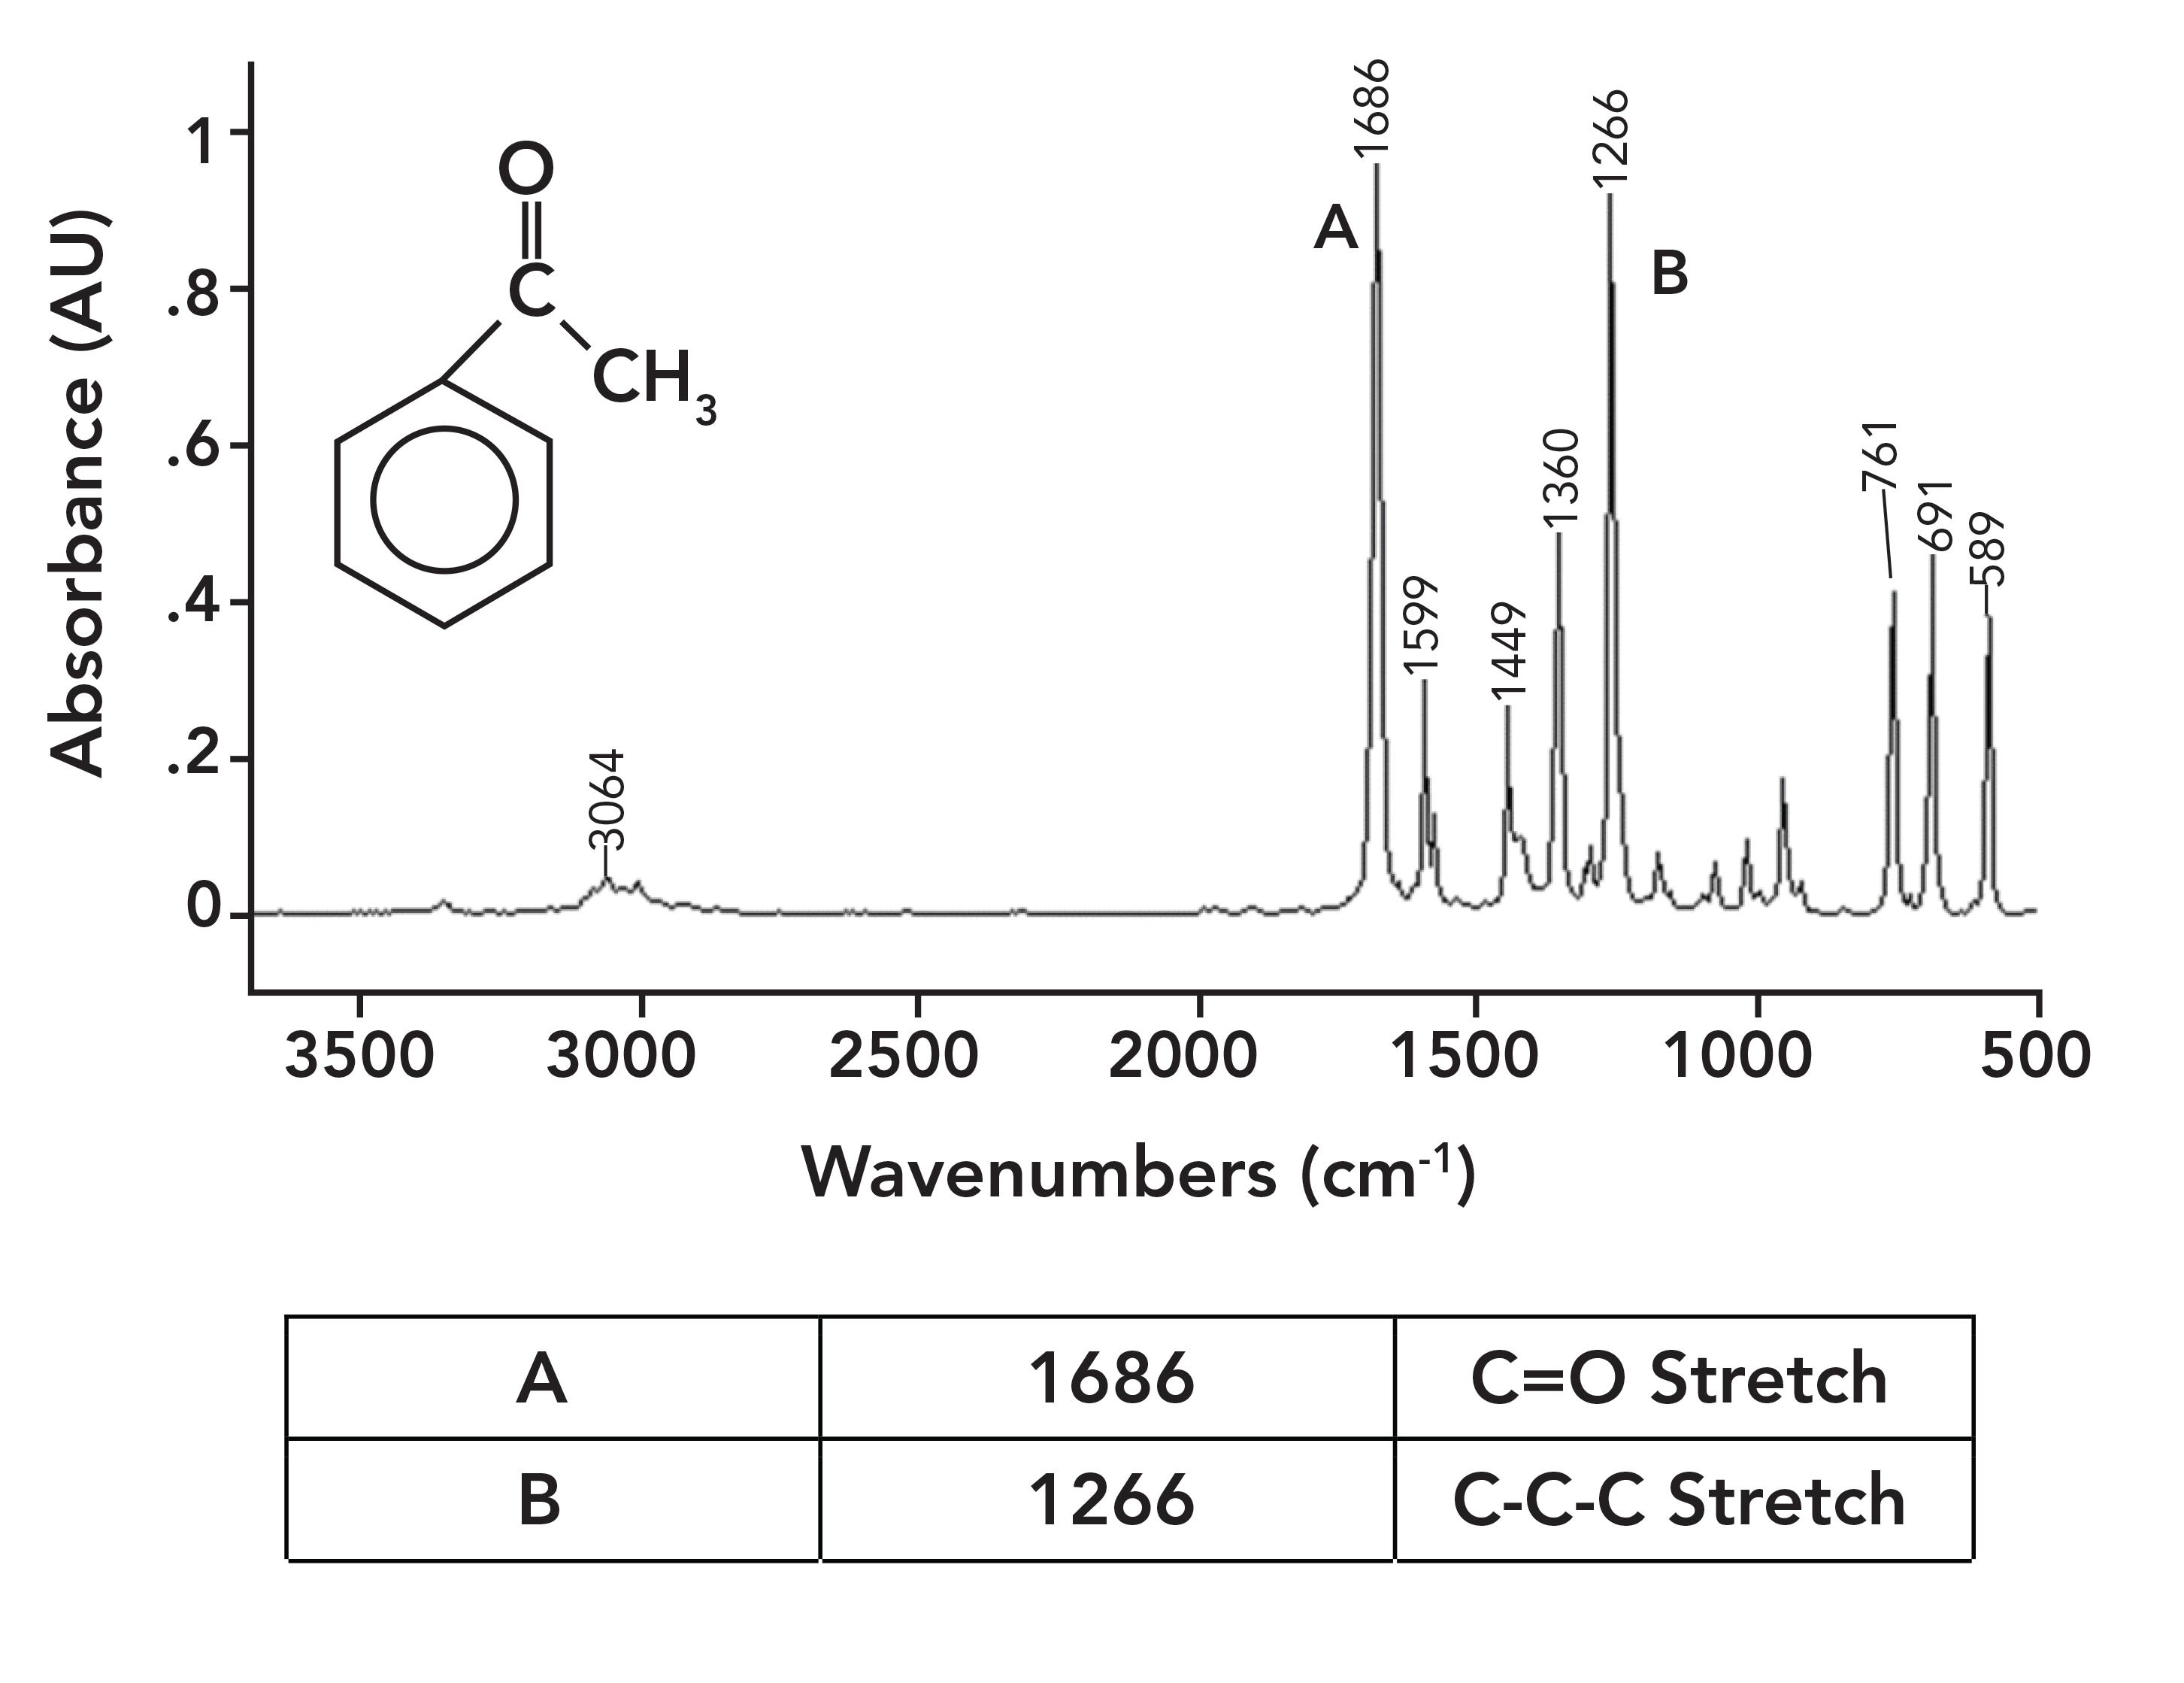
In general, we find that conjugated C=O groups have carbonyl stretching vibrations about 20–30 cm-1 lower than non-conjugated carbonyl groups. That is why going forward we will be quoting two peak position ranges for each carbonyl-containing functional group we study, one for the saturated version of the functional group and one for the aromatic version.
The IR Spectroscopy of Ketones
Perhaps one of the most common chemical structures to contain a carbonyl group are ketone molecules. Ketones consist of a C=O with two carbons attached, one to the left and one to the right as illustrated in Figure 7.
Figure 7: The structural framework of the ketone functional group.
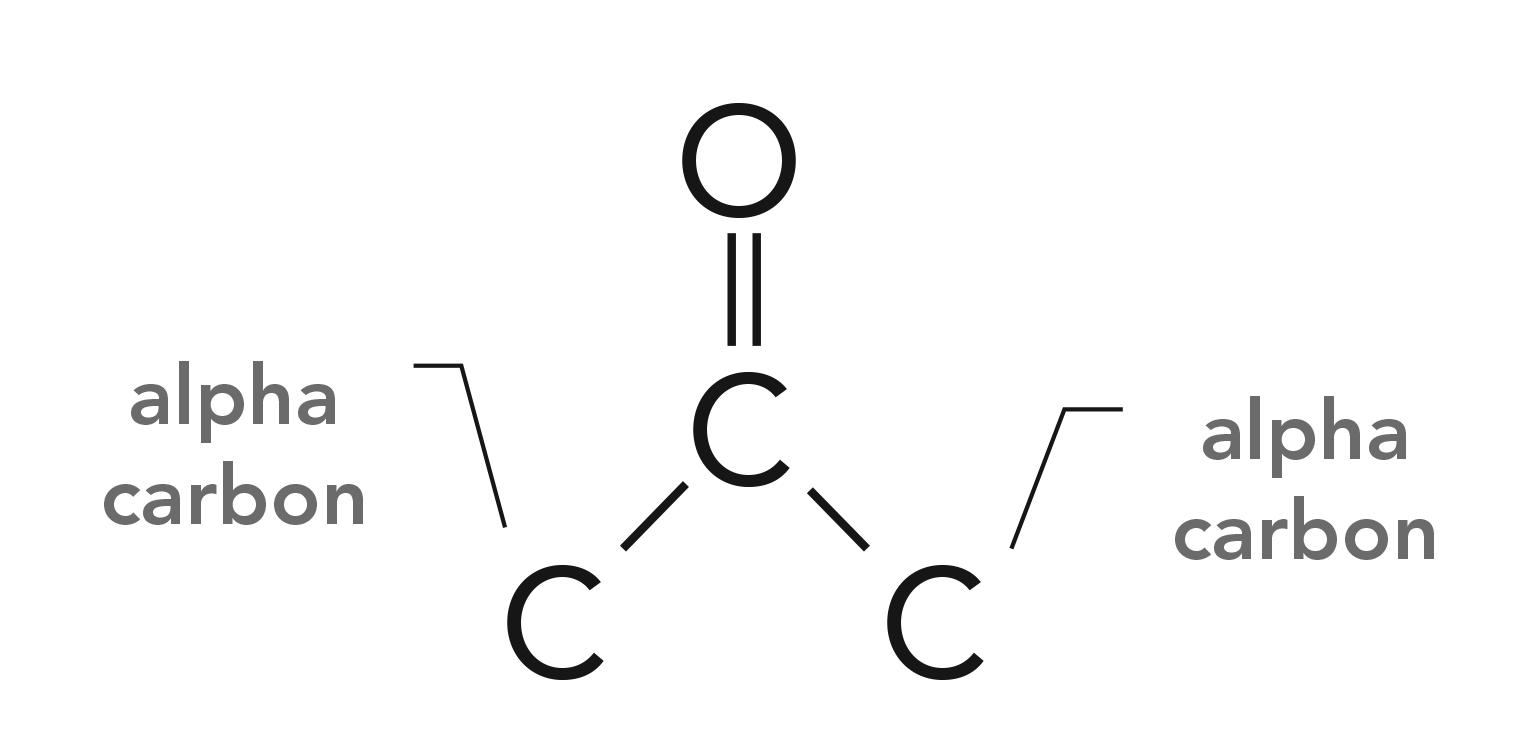
Note that the carbons attached to the carbonyl carbon are denoted “alpha carbons.” If both alpha carbons are saturated, we speak of saturated ketones, and if one or both alpha carbons are saturated, it is called an aromatic ketone.
A common example of a ketone-containing molecule is acetone (dimethyl ketone), whose IR spectrum we have already seen in Figure 5. The carbonyl stretch of acetone falls at 1716, and it is labeled A in Figure 5. In general, for saturated ketones, this peak appears at 1715±10. Note how large this peak is, and how it is easily the biggest in the spectrum.
It is tempting to assume that the carbonyl stretching peak for ketones uniquely identifies them, but this is not the case. Polymers containing saturated esters, aldehydes, and carboxylic acids among others have their C=O stretching peaks at approximately 1715 as we will see in future columns. Thus, the C=O stretching peak is diagnostic for carbonyl groups but not for anything else. We are dependent upon other peaks in IR spectra besides the C=O stretch to distinguish the different types of carbonyl-containing functional groups from each other.
For ketones, the peak that can help distinguish them from other functional groups is the C-C-C stretching vibration, which is illustrated in Figure 8.
Figure 8: The C-C-C stretching vibration of ketones.
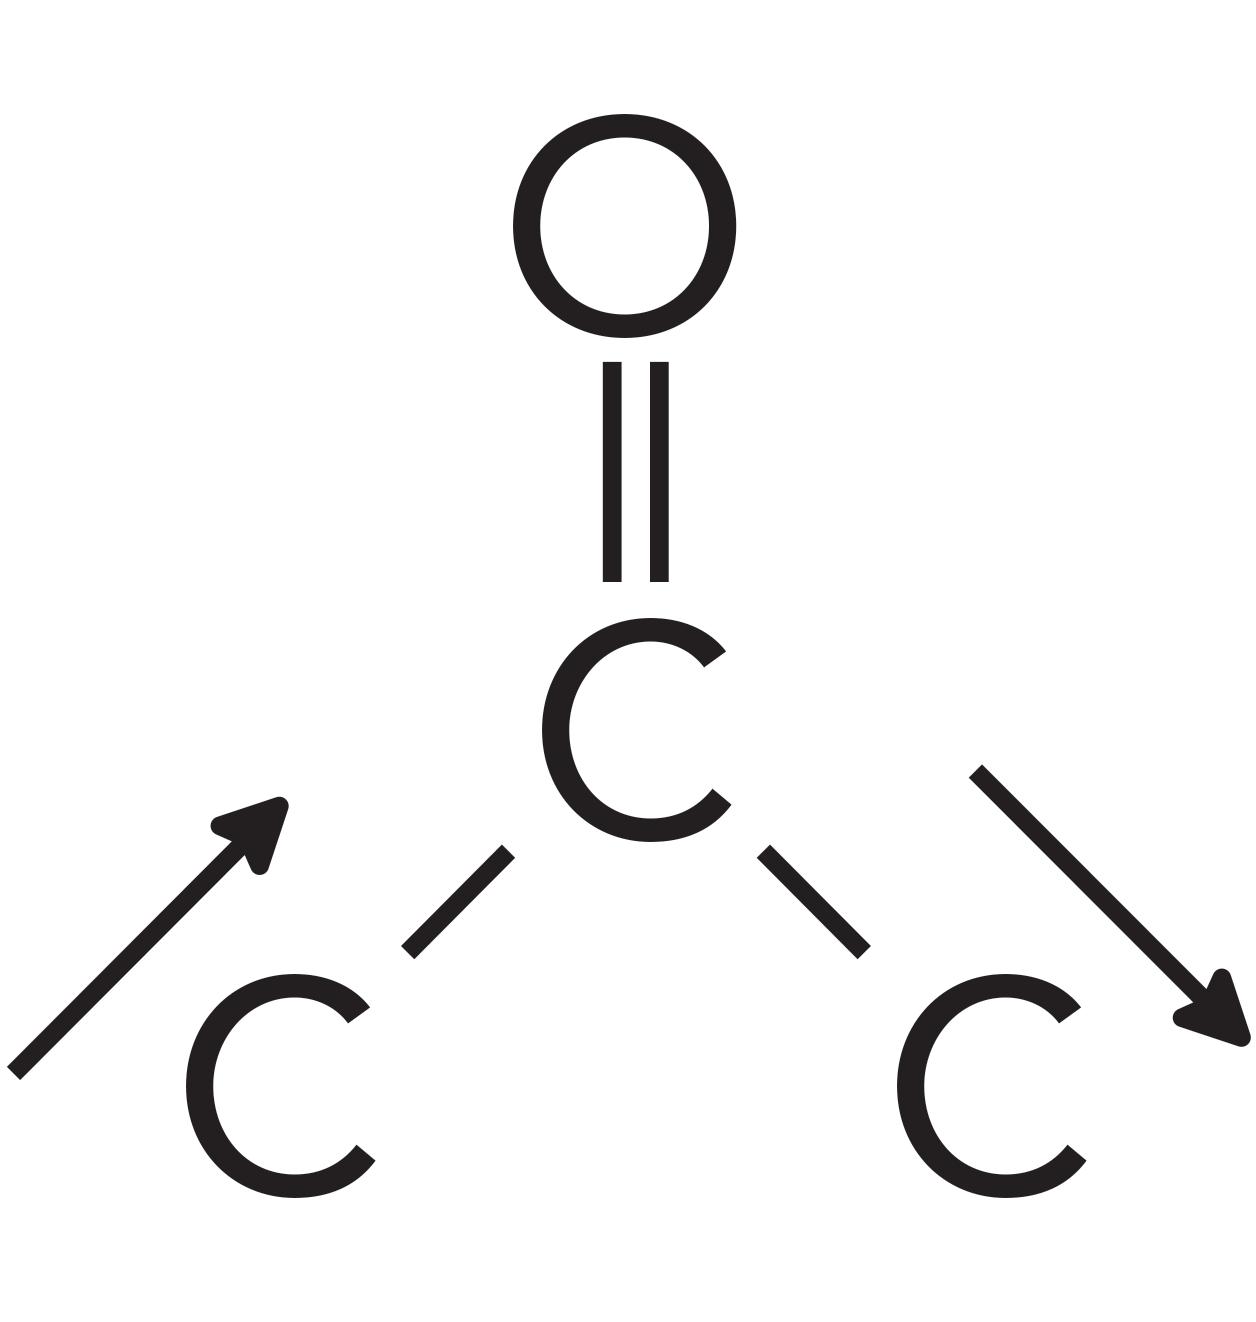
Note that this vibration involves the two alpha carbons stretching asymmetrically about the carbonyl carbon. This vibration gives rise to an intense peak between 1230 and 1100 for saturated ketones. This peak appears in the spectrum of acetone in Figure 5 at 1222 and is labeled B. Note that it is the second largest peak in the spectrum.
Normally, a C-C stretching vibration peak is small because the electronegativity difference between the carbon atoms is often negligible, giving non-polar bonds and small values of dµ/dx (1). However, the carbonyl carbon in the C=O bond has a large positive partial charge on it as seen in Figure 1. This large positive partial charge polarizes the bonds to the two alpha carbons, and when these C-C bonds stretch and the dµ/dx is large, it results in a large ketone C-C-C stretching peak seen in Figure 5.
Acetophenone is an example of an aromatic ketone, and its spectrum is seen in Figure 6. Although there is an aromatic and a saturated carbon attached to the carbonyl carbon in acetophenone, it is considered an aromatic ketone, which is because it only takes the presence of a single aromatic substituent to engage in conjugation and lower the carbonyl stretching peak position. Note in Figure 6 that the C-C-C stretch is at 1266 and is labeled B. The general range for the C-C-C stretch of aromatic ketones is 1300 to 1230.
Table I summarizes the group wavenumbers for keytones.

Note in Table I that both the C=O stretch and C-C-C stretching peak positions are sensitive as to whether the ketone is saturated or aromatic. The C=O stretch of saturated ketones falls above 1705, whereas for aromatic ketones it falls below 1700. Additionally, the C-C-C stretch of saturated ketones falls below 1230, whereas for aromatic ketones it falls above 1230. Thus, either one of these peaks can be used to distinguish saturated from aromatic ketones.
Polyetheretherketone (PEEK)
The fact that the name of this polymer contains the word ether twice just might make you think that it contains ether linkages only, but it also has a ketone in it per the last part of its name.
Polyetheretherketone is a copolymer made from monomers that form ketone and ether linkages upon the formation of the polymer. We discussed the ether linkages of PEEK in the last column (4); here, we focus on its ketone functional group. The structure and spectrum of PEEK are shown in Figure 9.
Figure 9: The IR spectrum of polyetheretherketone (PEEK).
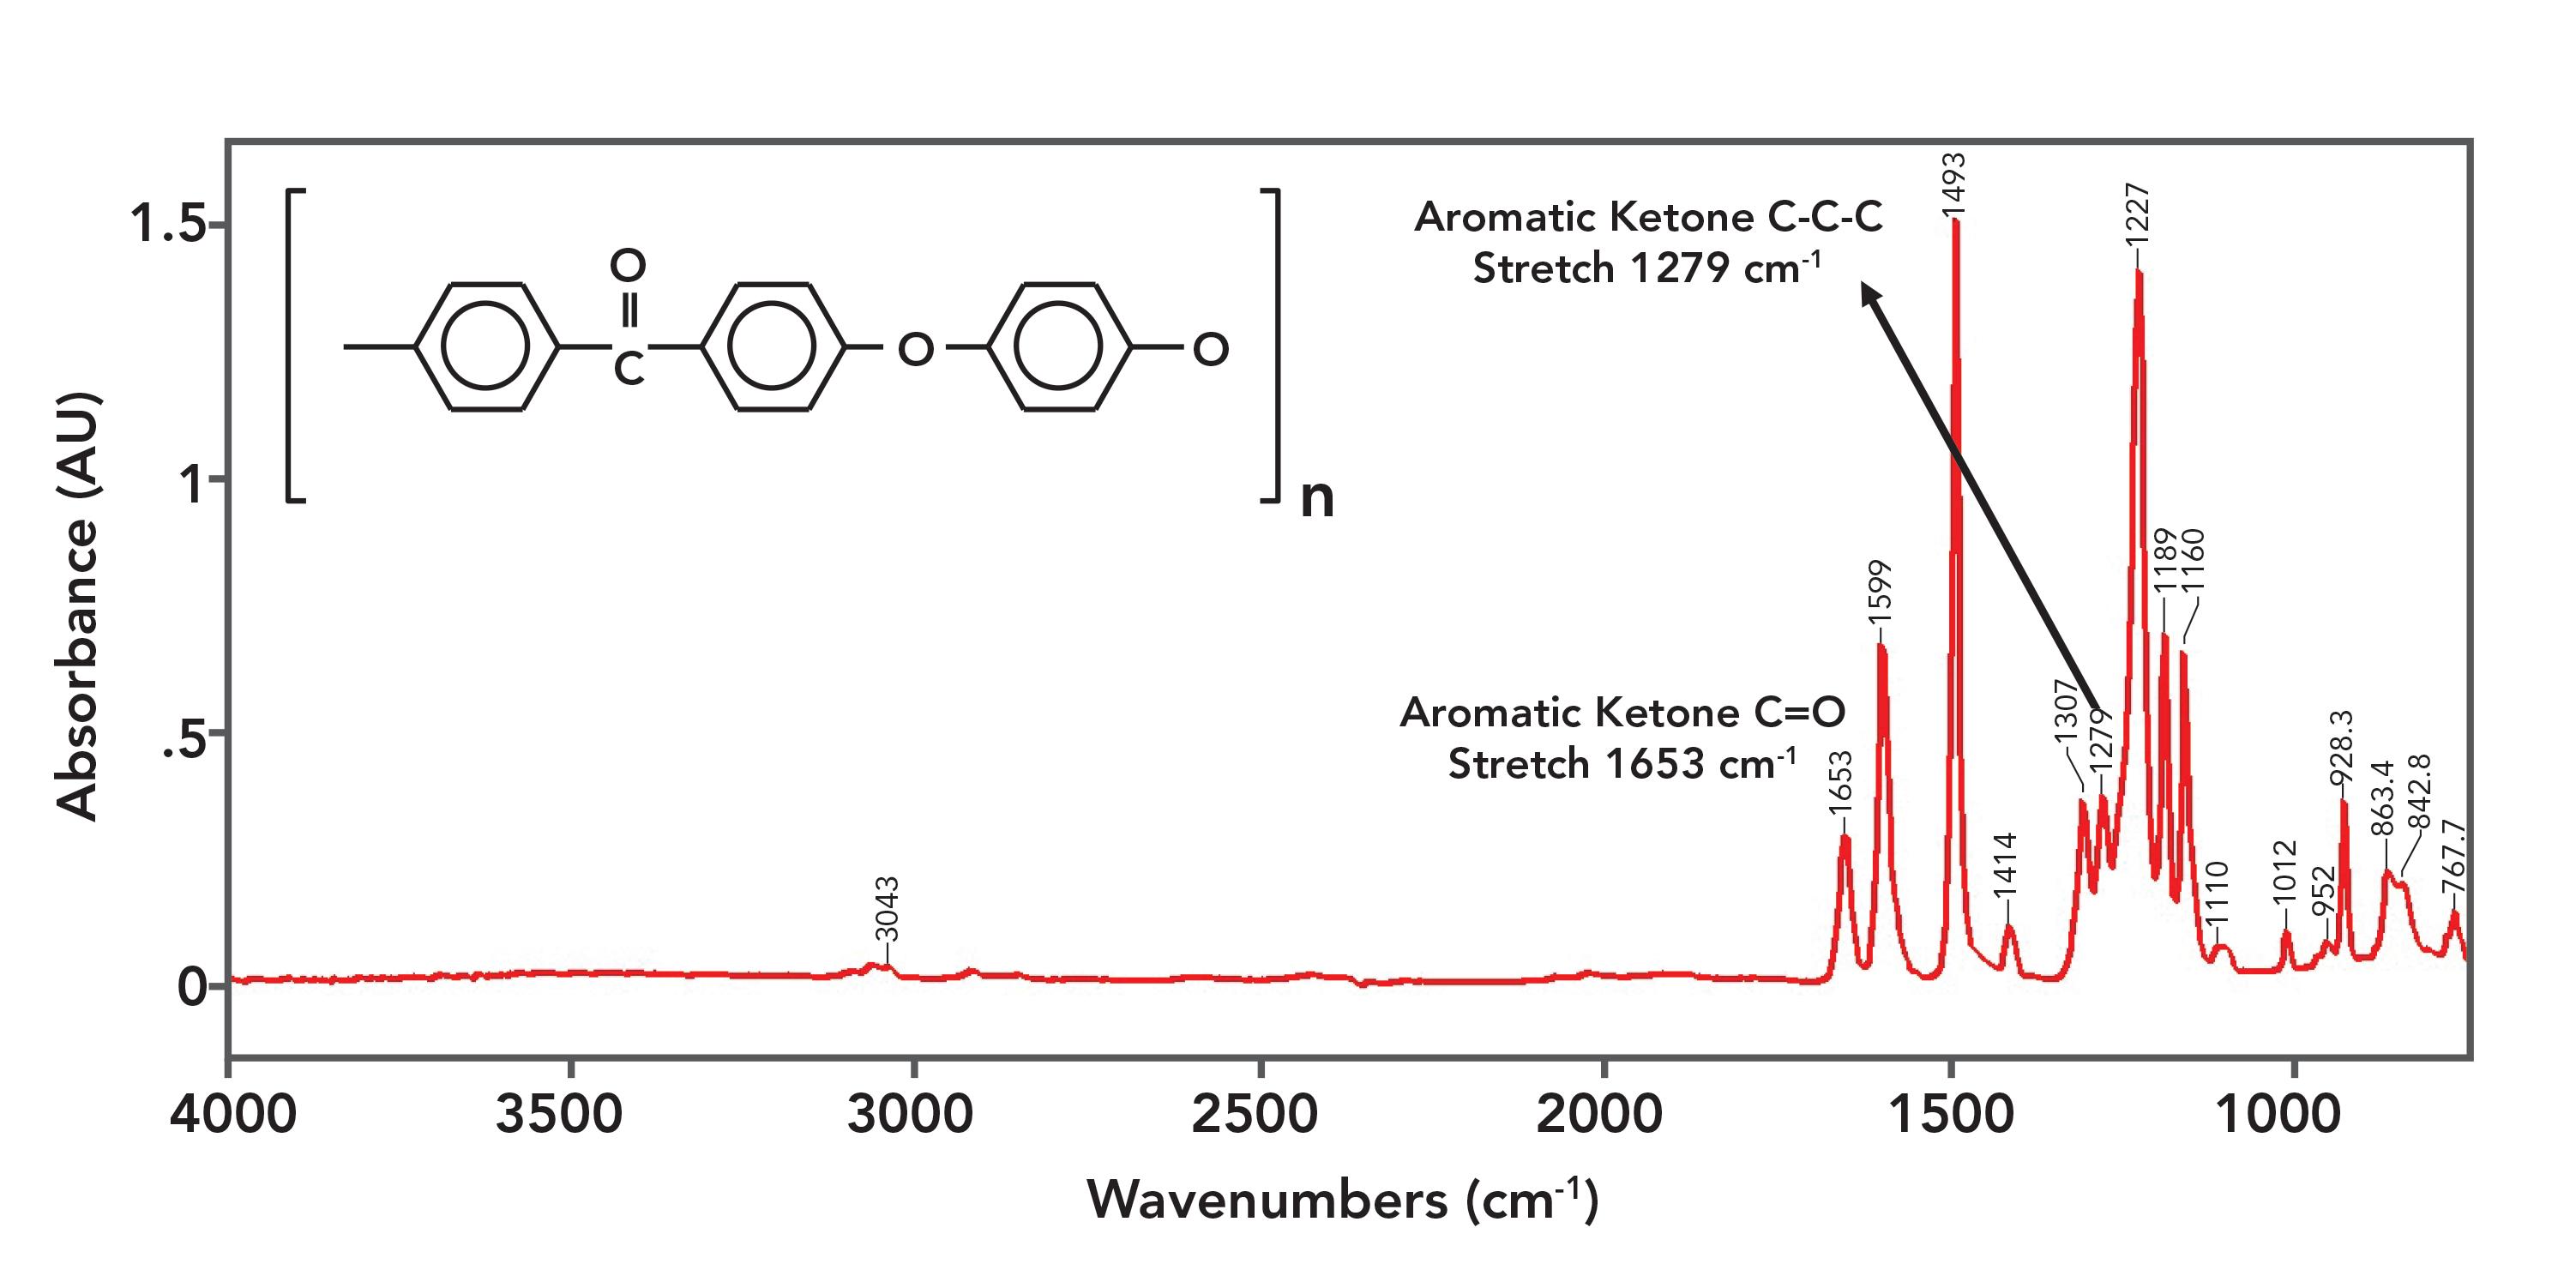
The spectrum of PEEK is a little strange in that the ketone peaks are not the biggest in the spectrum. This honor goes to the C-O stretching peak of the aromatic ether linkages and ring modes from the benzene rings present. These peaks are so large because the repeat unit contains two ether linkages and three benzene rings respectively.
The C=O stretch of PEEK is at 1653, agreeing with the position of aromatic ketone C=O stretches stated in Table I. The C-C-C stretch of PEEK is seen at 1279, which also agrees with Table I. PEEK is one of the few polymers that contains a ketone linkage.
Conclusions
In this introduction to the spectra of carbonyl containing polymers, we reviewed the structure and bonding of the C=O bond. We found that the C=O bond has a large dipole moment and gives strong carbonyl stretching peaks in the 1900 to 1600 range. We also saw how conjugation can alter the force constant of the C=O bond, lowering its stretching peak position.
We then reviewed the spectra of saturated and aromatic ketones, and discussed how the diagnostic peak pattern for ketones is a C=O stretch approximately 1700 and a C-C-C stretch around 1200. Both of these peaks are sensitive as to whether the ketone is saturated or aromatic, so either can be used to determine what type of ketone is present in a sample. We then analyzed the spectrum of polyetheretherketone, a ketone containing polymer.
References
- B.C. Smith, Spectroscopy 30(1), 16–25 (2015).
- B.C. Smith, Spectroscopy 31(3), 34–37 (2016).
- B.C. Smith, Spectroscopy 32(9), 31–36 (2017).
- B.C. Smith, Spectroscopy 37(5), 15–19,27 (2022).
Brian C. Smith, PhD, is the founder and CEO of Big Sur Scientific, a maker of portable mid-infrared cannabis analyzers. He has over 30 years experience as an industrial infrared spectroscopist, has published numerous peer-reviewed papers, and has written three books on spectroscopy. As a trainer, he has helped thousands of people around the world improve their infrared analyses. In addition to writing for Spectroscopy, Dr. Smith writes a regular column for its sister publication Cannabis Science and Technology and sits on its editorial board. He earned his PhD in physical chemistry from Dartmouth College. He can be reached at: SpectroscopyEdit@MMHGroup.com


AI Shakes Up Spectroscopy as New Tools Reveal the Secret Life of Molecules
April 14th 2025A leading-edge review led by researchers at Oak Ridge National Laboratory and MIT explores how artificial intelligence is revolutionizing the study of molecular vibrations and phonon dynamics. From infrared and Raman spectroscopy to neutron and X-ray scattering, AI is transforming how scientists interpret vibrational spectra and predict material behaviors.
Real-Time Battery Health Tracking Using Fiber-Optic Sensors
April 9th 2025A new study by researchers from Palo Alto Research Center (PARC, a Xerox Company) and LG Chem Power presents a novel method for real-time battery monitoring using embedded fiber-optic sensors. This approach enhances state-of-charge (SOC) and state-of-health (SOH) estimations, potentially improving the efficiency and lifespan of lithium-ion batteries in electric vehicles (xEVs).
New Study Provides Insights into Chiral Smectic Phases
March 31st 2025Researchers from the Institute of Nuclear Physics Polish Academy of Sciences have unveiled new insights into the molecular arrangement of the 7HH6 compound’s smectic phases using X-ray diffraction (XRD) and infrared (IR) spectroscopy.