Using Multivariate Curve Resolution to Identify the Evolved Gases Created During a TGA-IR Experiment
Application Notebook
Thermal decomposition provides valuable information about the chemical composition of a material. Although thermal gravimetric analysis (TGA) measures small weight losses during a heating ramp, it cannot identify the chemicals corresponding to the weight loss.
Thermal decomposition provides valuable information about the chemical composition of a material. Although thermal gravimetric analysis (TGA) measures small weight losses during a heating ramp, it cannot identify the chemicals corresponding to the weight loss. The sensitivity and speed of FT-IR makes it an ideal detector for the TGA evolved gas, but the interpretation of the large data files resulting from this hyphenated technique can be formidable. In this article, we describe an integrated approach that makes analyzing these large data sets much simpler.
Operators working with materials like rubbers, plastics, resins, pharmaceuticals, adhesives, and packaging need to understand differences between competitive products, causes of failures, or the origin of potentially toxic off-gassing. Standard analytical procedures are often incapable of distinguishing subtle differences like the presence of low-concentration additives or contaminants. Further, the same components may be present in two different materials, but the process used to make the products — such as the processing temperature — may vary, causing the interactions between components in the material to differ. This can lead to poor performance, such as early material fatigue or material failure. A complete analysis requires these materials to be deformulated — essentially torn apart to expose their underlying nature. Thermal TGA is a common tool for doing this. A temperature ramp is applied to the sample and the breakdown tracked through weight loss as components vaporize. Attaching a heated transfer line from the TGA outlet to a heated gas cell in the FT-IR spectrometer enables spectra to be acquired in real time as the gases evolve. The resulting data set contains several hundred spectra creating a complex data analysis challenge. Commonly, thermal degradation results in numerous chemicals being evolved simultaneously — not one at a time — resulting in a series of mixture spectra. The Thermo Scientific™ OMNIC™ Mercury TGA algorithm deconvolutes these spectra and provides both identification and time evolution information, completing the deformulation analysis.
Experimental
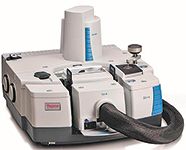
Figure 1 shows a Thermo Scientific Nicolet™ iS™50 FT-IR spectrometer and the TGA-IR accessory. The flexible transfer line, heatable to 300 °C, couples the outlet of the TGA to the IR gas cell.

Figure 1: TGA-IR accessory mounted in the sample compartment of the Nicolet iS50 FT-IR spectrometer.
The TGA-IR data set is three dimensional — frequency versus intensity (the spectrum) versus time. Typical TGA experiments ramp and hold for 30–60 min. The FT-IR normally collects multiple scans resulting in one spectrum about every 5 s. For a 1 h run, this yields 720 spectra — a daunting analytical challenge.
Results and Discussion
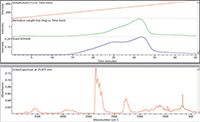
Figure 2 shows the TGA-IR results for the thermal decomposition of a wood sample. The top of the figure contains the temperature ramp and first derivative weight loss from the TGA and a Gram-Schmidt (GS) profile. The GS profile essentially shows the total change in the IR signal (similar to a chromatogram). The bottom pane contains the spectrum collected at one time point. The analytical challenge involves the extraction of useful information from this data set.

Figure 2: TGA-IR results for wood sample. The top section includes the temperature ramp and the first derivative of the weight loss (from the TGA), along with the Gram-Schmidt profile for the FT-IR data. The bottom is a spectrum at a single time point.
The key function of deformulation analysis involves identifying the various components and measuring a unique time/temperature response curve (profile) for each component. The profiles reveal when a gas starts evolving (time = temperature) and the duration of the gas evolution. Manual processing can take upwards of an hour. The Mercury TGA algorithm automates the analysis, by first performing a multivariate curve resolution (MCR) analysis on the series of spectra to extract the causes of the spectral differences observed in the data set. The MCR approach creates vectors that correspond to the linearly independent spectral features; these vectors are commonly called Pure Component spectra. Further processing ends with library searching and profile preparation and presentation.
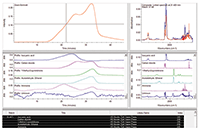
The wood sample TGA-IR data file in Figure 2 consisted of 450 spectra. The database chosen for the final step was the 460 spectra from the High Resolution Nicolet™ TGA Vapor Phase library. The complete process resulted in the presentation of Figure 3 in less than 20 s. The upper left corner of the display is the GS Profile, as seen in Figure 2. Below that are the calculated time profiles for each evolved gas component. Note how the gases evolve at different times during the deformulation, with a complex pattern of overlapping profiles. To the right of the profiles are the spectra of the identified gases from the library. The table at the bottom provides text information about the search results. The last profile and spectrum, labeled "Unknown," show what is essentially a residual of the analysis — the spectral components of the overall run for which the algorithm has not yet accounted. In this case, the unknown profile is mostly noise, indicating that the majority of the spectral features are assigned.

Figure 3: The Mercury TGA result for the wood sample shown in Figure 2.
The upper right window is critical to the user experience. This shows the composite spectrum (in red) synthesized from the library spectra of the identified species compared to the actual spectrum (in blue) at a particular time point. Note this does not include the "Unknown" component, so it represents the analytical results only. Scrolling the time bar in the GS pane (upper left) allows the user to compare each spectrum to a calculated composite at that time — essentially playing back the synthetic and actual series files simultaneously. This display allows the user to assess if the algorithm has identified all of the critical components in the file. The algorithm allows the user to add more components and re-calculate, until complete identification of all off-gassing components has been accomplished.
Conclusions
Deformulation remains a core requirement for many materials laboratories. While weight loss and identification are important, the additional information gleaned from the time (temperature) dependence of the gas evolutions provides insights into the process used to create the material. The unique combination of quantitative data from the weight loss, qualitative analysis of the components, and process insights from the profiles shows the strong motivation behind the hyphenated TGA-IR technique.
Thermo Fisher Scientific
5225 Verona Rd., Madison, WI 53711
tel. (800) 532-4752, fax (608) 276-6100
Website: www.thermoscientific.com/ftir

Thermo Fisher Scientists Highlight the Latest Advances in Process Monitoring with Raman Spectroscopy
April 1st 2025In this exclusive Spectroscopy interview, John Richmond and Tom Dearing of Thermo Fisher Scientific discuss the company’s Raman technology and the latest trends for process monitoring across various applications.
A Seamless Trace Elemental Analysis Prescription for Quality Pharmaceuticals
March 31st 2025Quality assurance and quality control (QA/QC) are essential in pharmaceutical manufacturing to ensure compliance with standards like United States Pharmacopoeia <232> and ICH Q3D, as well as FDA regulations. Reliable and user-friendly testing solutions help QA/QC labs deliver precise trace elemental analyses while meeting throughput demands and data security requirements.