Valuable Techniques for Repeatable Absorbance Measurements
Spectroscopy offers a range of available techniques that can be differentiated by the use or omission of reference spectra. This differentiation means that techniques such as Raman or fluorescence typically look at raw intensity outputs, whereas techniques such as transmission or reflectance require some reference scan to calculate those relative outputs. Within the group of referenced spectral techniques, absorbance is easily one of the most common and offers much value because of the concentration dependence of Beer’s Law. However, this value is only properly captured when system components and samples are made to be repeatable, both for the reference scans and live acquisitions. This article discusses several useful techniques to establish this repeatability, including proper cuvette and probe handling, component setup, and sample considerations. By optimizing repeatability of the measurement system, the observed concentration values calculated from absorbance outputs are much more accurate and relevant to the sample being measured.
Think back to the first time you baked something, swung a golf club, or typed on a keyboard. How did you do? Were you as good the second time? Were you as good as you are today? Most likely, the answer is “No,” because it took some experience to build and understand the techniques needed to perform each activity effectively. Without proper technique, we do not see our efforts result in us reaching our true potential, but without experience, we never have the chance to build those techniques. Spectroscopy is no different, and each spectral method has its own tricks to pull more out of the measurement than would be possible otherwise.
Modern times give focus to more modern spectral techniques, and rightfully so. We now see a rapid democratization of Raman and time-resolved measurements that were once largely restricted by bulky instrument size and high cost, which is fantastic news because it gives more researchers opportunities to push boundaries and open new doors. However, there is also value in remembering traditional techniques and the methods that brought us to where we are today. Whether reflection, transmission, absorbance, fluorescence, or others, these traditional approaches are by no means “done” in their development and deployment; rather, we can always improve old techniques with new considerations.
Absorbance is one technique that stands a bit taller than the rest. The origin of the absorbance concept that we know today began in the early 1700s when French mathematician and scientist Pierre Bouguer expressed curiosity about the transmission of light through his wine when he was on vacation in Portugal. Bouguer’s curiosity resulted in him making some measurements to discover that the light attenuation was not linear as the distance (pathlength) increased, but rather followed an exponential trend. More than a century later, German physicist August Beer made a secondary discovery in this same area, noting that the same exponential trend was seen when the concentration of the attenuating species changed and the distance remained constant. Bringing these two observations together under a common relationship gives us the Beer-Lambert law we are all familiar with today:
A = εlc [1]
where A equals absorbance; ε equals the molar attenuation coef ficient; l equals the optical pathlength; and c equals the concentration.
The discovery of the Beer-Lambert law was a big deal at the time and remains important today. Beer’s law allows us to quickly convert optical signals into meaningful concentration values for all sorts of systems. It lets us shine light on something and know how much light is there. The specific sample being measured determines what “mode” was used to interrogate the sample, which could include transmission, reflection, or in rarer cases, evanescent interactions.
Perhaps the most common mode of absorbance measurement is transmission, and within that, most commonly the transmission of liquids like Bouguer’s wine. Transmission is only feasible if the sample is transmissive in the spectral region of interest, though a simple visual check may not be sufficient. It is possible that a crystal-clear sample can be a massive UV-range filter, which would make UV absorbance regressions impossible in transmissive mode. Conversely, you could have something that looks solid and not optically transmissible but may give very usable transmission in the near-infrared (NIR) wavelength range. The more the sample is absorbed, the harder it will be to get meaningful and coherent photons through to the other side. Your two most important tools to help with this process include a stronger light source and a shorter pathlength. More photons at the input will give you more photons at the output, and the less sample the light has to interact with will also allow more light through.
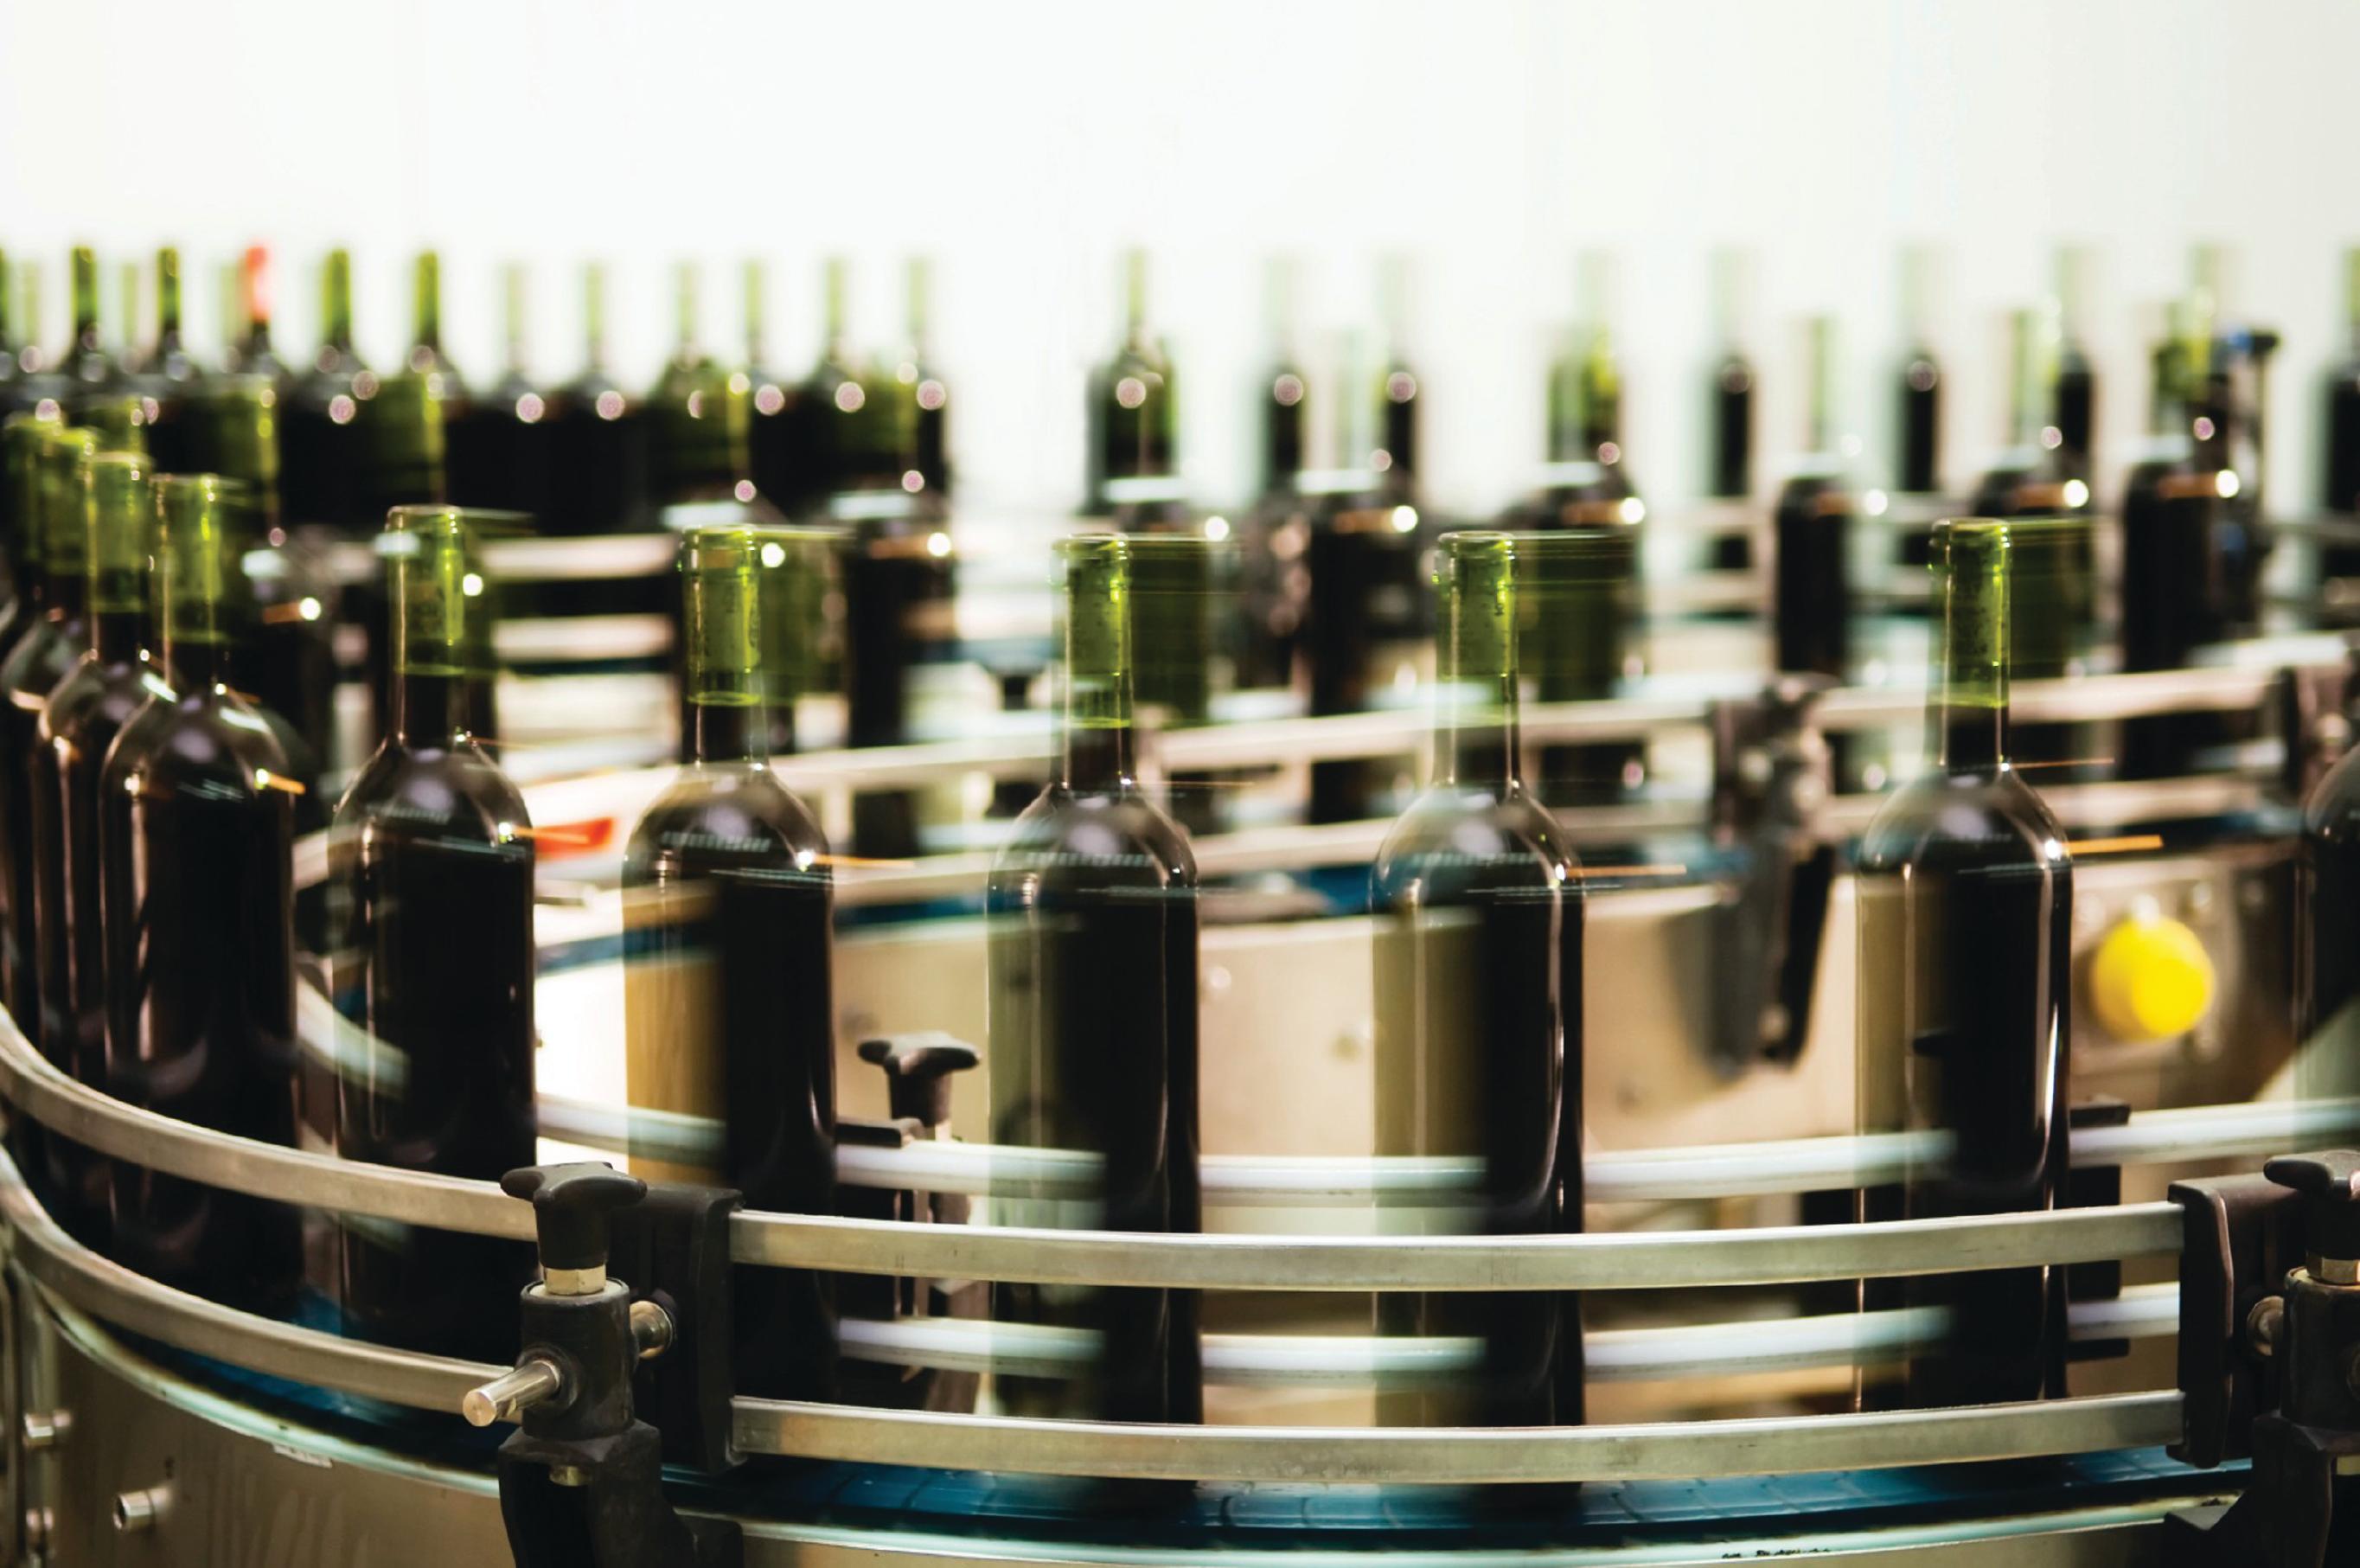
Think back to Bouguer’s wine. Compared with a light white wine, a dark red wine would need a stronger light source, a shorter pathlength, or both, to get coherent measurements. However, at some point, the sample may be too thick or optically dense for transmission to work well. In that scenario, it may make more sense to look at the reflective mode (Figure 1). Samples like whole blood or plant extracts can give the same valuable absorbance information, but instead of passing light through the sample, we can bounce the light off the sample surface. A third approach using evanescent interactions could be considered a fusion of these two approaches because the evanescent waves interact “through” the sample but only at the primary surface interface. The specific system you’re working with will dictate what makes sense for data acquisition.
Figure 1: To derive meaningful spectral data from optically dense samples, such as dark wines, may require the use of reflectance techniques. The above is an image of wine in bottles during the packaging process.

When working in transmissive mode, you will likely be using some type of cuvette (or cuvet) and cuvette holder to manage your sample, and there are some key considerations with that setup to make the best measurements possible. When using fiber optics for connecting the various optical components, ensure the fiber connections are threaded tightly and do not have the ability to rotate. Also, it is important to ensure that the fibers are positioned so that they aren’t frequently moved or touched. Fiber movement can be a leading cause of odd absorbance behaviors, so always keep this thought in mind when you plan to work in transmissive mode.
The cuvette should be optically clean on the inside and outside. If being moved between measurements, the cuvette should be placed in the same orientation; cuvettes often have a marker near the top to assist with this step. The cuvette should sit snuggly within the holder, so that there is minimal-to-no play in its movement or resting position. There is often a set screw to tighten the fitting of the cuvette. It is important to be careful not to crack the cuvette when adjusting this, especially with expensive quartz cells. When using the same cuvette for multiple samples, it is also important that you ensure the cell has been sufficiently flushed with the new sample so that you do not see contamination from a previous sample.
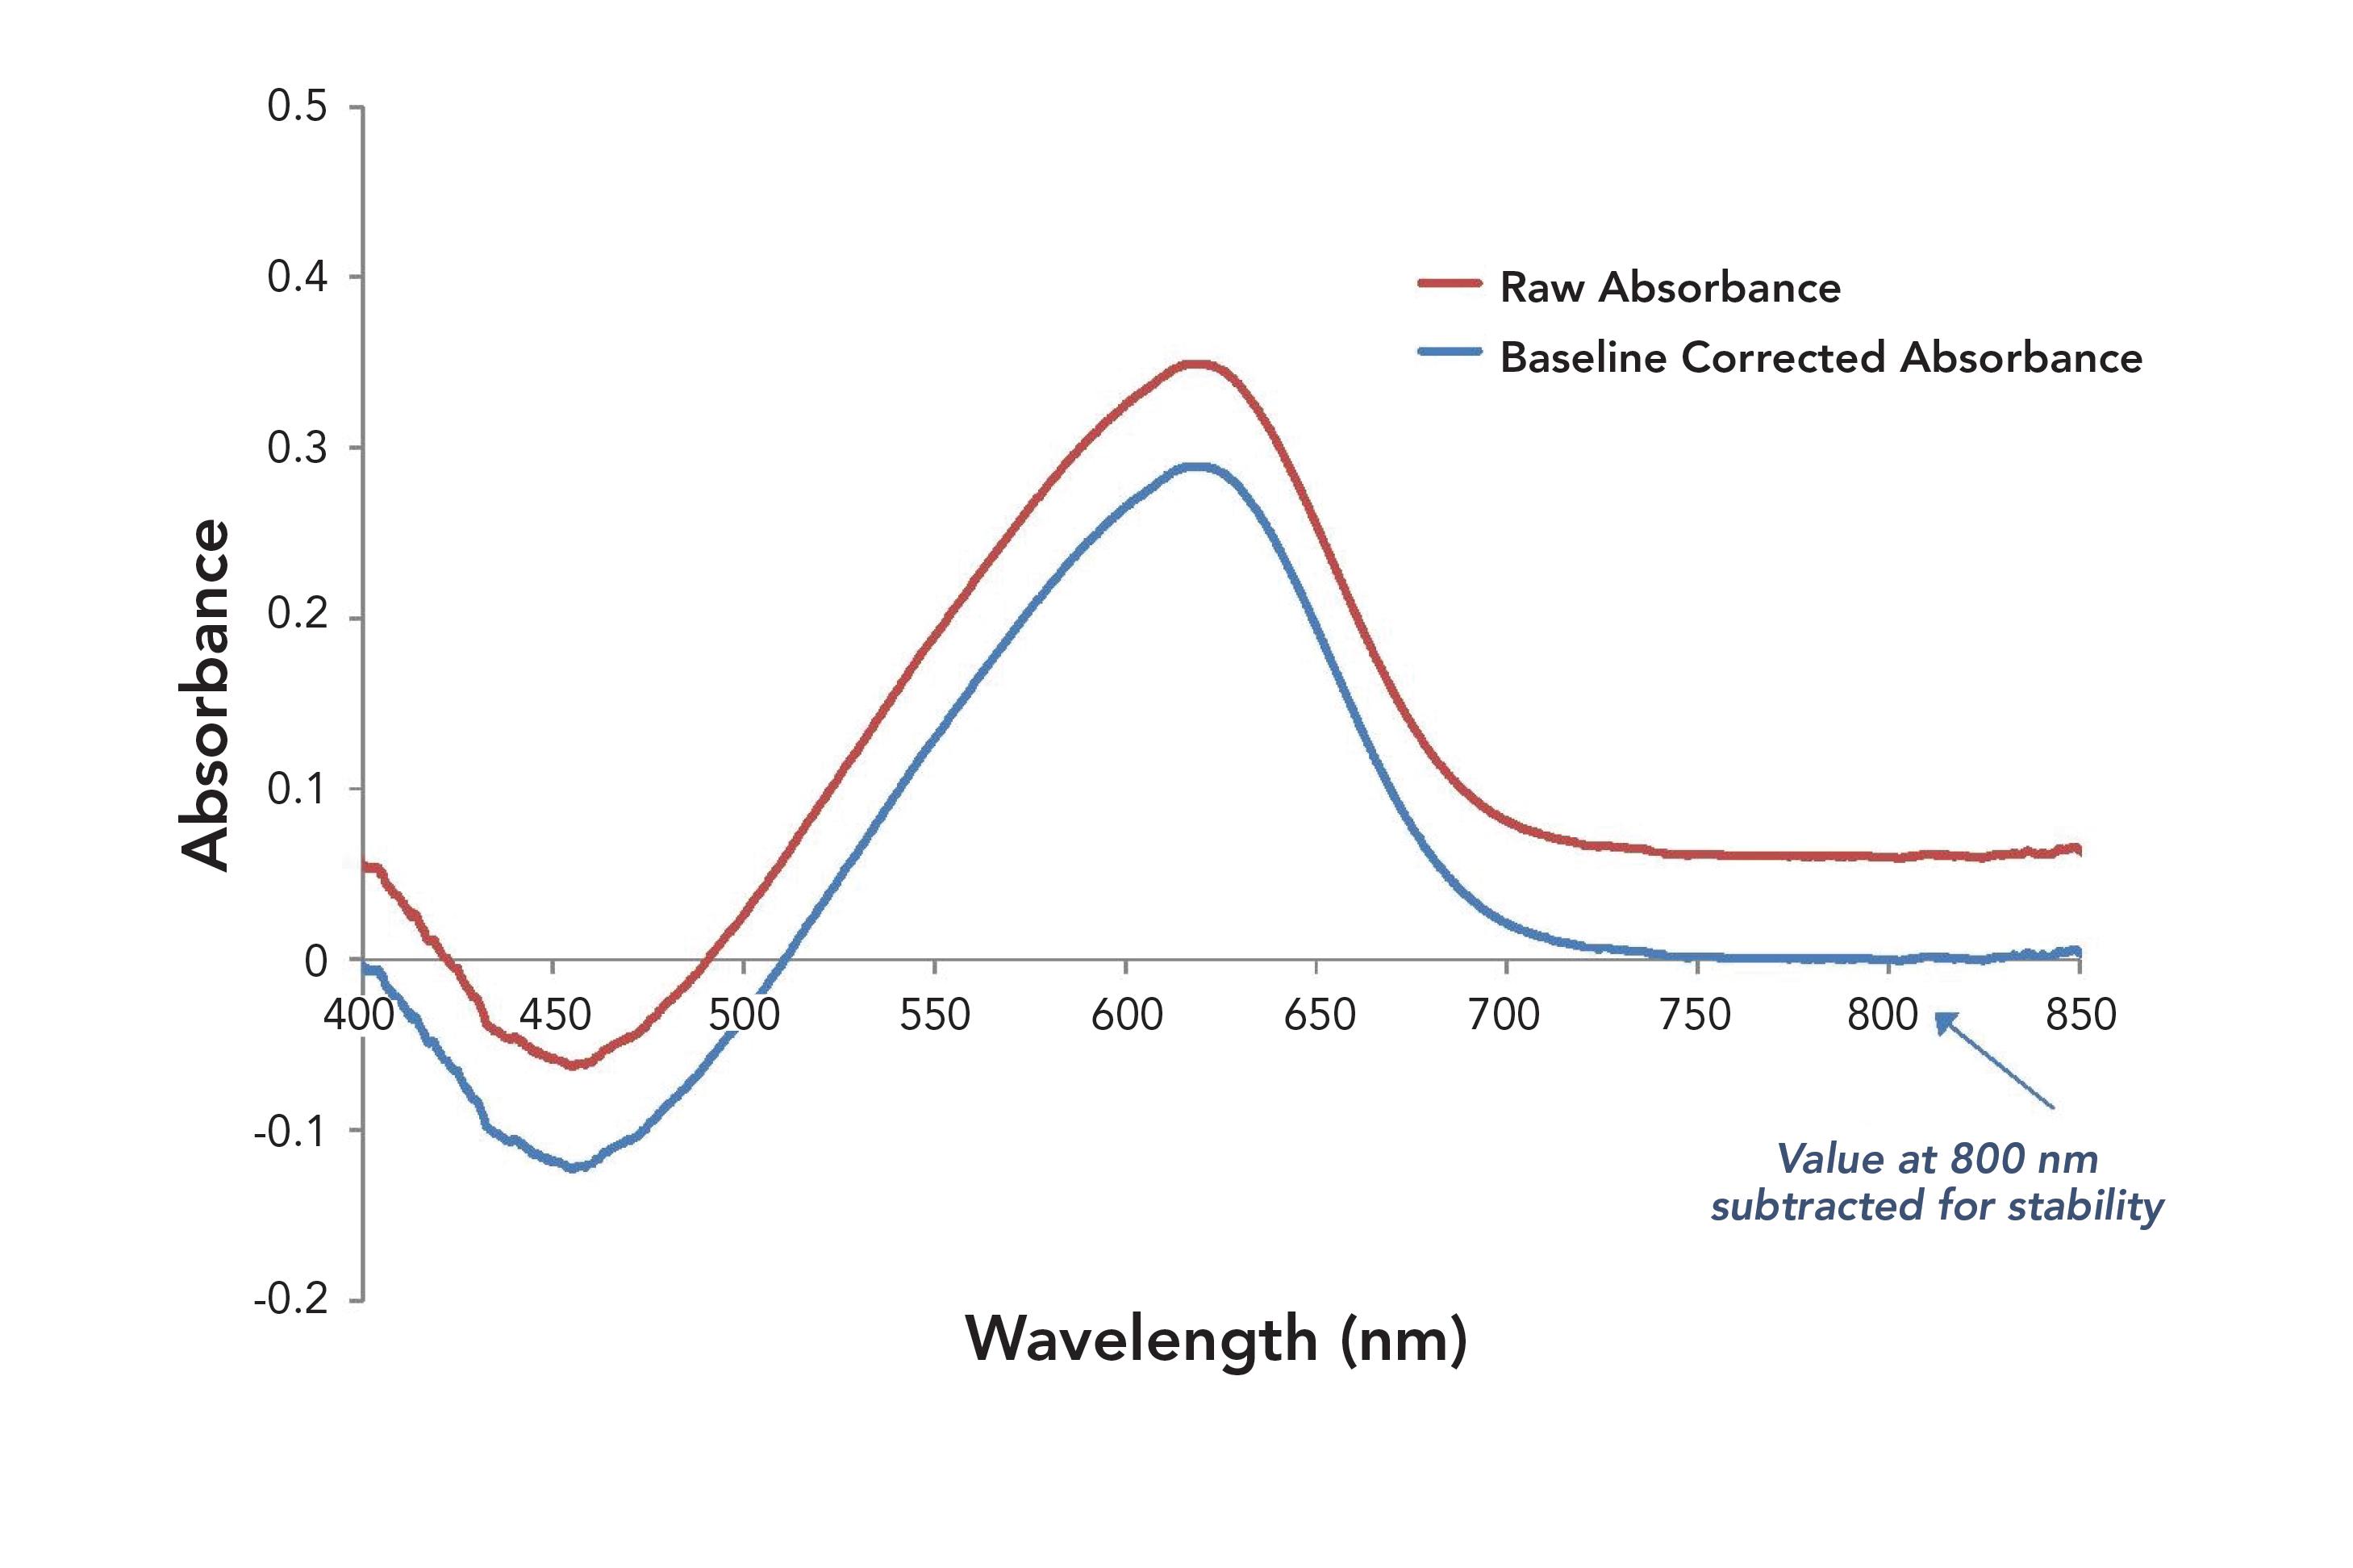
Typically, it is more dif ficult to achieve repeatable absorbance scans in reflective mode than transmissive mode, which is largely because of the more consistent nature of the transmissive hardware we discussed above. Cuvettes are convenient because they snap right into place! Reflective probes and holders often require a greater level of physical sturdiness and placement considerations to get the same results, so taking the time to develop a proper opto-mechanical fixture can make all the difference in the world for this approach. Think about distance and angle, not just of the optical probe versus the stage but versus the sample. For example, if the sample is a powder that may have variable height, think about how the probe could be designed so that it sees a flat portion of the powder at the same distance each time. Sometimes, using a region of the spectrum known to have a good baseline for a sanity check can be valuable in ensuring the system “sees” the sample as it had before (Figure 2).
Figure 2: Absorbance of pH-responsive dye showing raw (red) and single-point baseline corrected (blue) spectra. Baseline correction of absorbance data can be applied to help mitigate the effects of measurement variability.

However, hardware is only half the battle in the world of modern science, where software plays just as (if not more) critical a role in determining the validity and value of our final result numbers. Although this article focuses on absorbance, a key first step of many traditional spectroscopy techniques is determining what sample condition creates the “brightest” scenario or the most photonic signal to the detector. Knowing the sample condition will allow you to complete the full range of acquisitions without saturating the detector and needing to adjust software parameters on the fly.
Set your integration time to approximately 80% saturation, and then adjust your averaging setting to establish the total scan time, which will be the integration time multiplied by the number of averages. Averaging can improve the stability of your output, but it also increases the measurement time. Boxcar, on the other hand, is a pixel-averaging setting that does not affect your total scan time and can be very helpful in cleaning up spectral outputs. The boxcar setting is the number of 2n+1 pixels that are averaged around the center pixel, such that a boxcar of n = 0 will treat every pixel independently, whereas a boxcar of 1 will average each pixel with the pixel immediately to the left and to the right of it. Having a boxcar of at least 1 will let the spectrometer function as a coherent system rather than as an array of independent detectors. Many absorbance applications deal with broad peak activities and applying boxcar can significantly help stabilize these broad trends across many scans. However, be careful: the sharper the peak activities, the lower the boxcar setting that should be used.
Taking quality absorbance measurements goes beyond simply dropping liquid into a cuvette; there are multiple considerations around spectral method, hardware setup, and software parameters. With the proper planning on the front end of your tests, you will set yourself up for accurate and valuable results at the output. Whether with spectral measurements or other efforts, you will bring yourself closer to success by knowing the details of the techniques as much as knowing the basics of the technology.
About the Author
Derek Guenther is a Senior Application Scientist at Ocean Insight. Direct corerspondence to: derek.guenther@oceaninsight.com.

New Study Reveals Insights into Phenol’s Behavior in Ice
April 16th 2025A new study published in Spectrochimica Acta Part A by Dominik Heger and colleagues at Masaryk University reveals that phenol's photophysical properties change significantly when frozen, potentially enabling its breakdown by sunlight in icy environments.
Karl Norris: A Pioneer in Optical Measurements and Near-Infrared Spectroscopy, Part I
April 15th 2025In this "Icons of Spectroscopy" column, executive editor Jerome Workman Jr. details how Karl H. Norris has impacted the analysis of food, agricultural products, and pharmaceuticals over six decades. His pioneering work in optical analysis methods including his development and refinement of near-infrared (NIR) spectroscopy has transformed analysis technology. This Part I article of a two-part series introduces Norris’ contributions to NIR.
Real-Time Battery Health Tracking Using Fiber-Optic Sensors
April 9th 2025A new study by researchers from Palo Alto Research Center (PARC, a Xerox Company) and LG Chem Power presents a novel method for real-time battery monitoring using embedded fiber-optic sensors. This approach enhances state-of-charge (SOC) and state-of-health (SOH) estimations, potentially improving the efficiency and lifespan of lithium-ion batteries in electric vehicles (xEVs).