3-D Confocal Raman Imaging
Application Notebook
For the characterization of the properties of a sample with Raman spectroscopy, an ultrasensitive confocal Raman microscope allows the acquisition of a Raman image stack revealing 3-D information on the distribution of the chemical compounds.
Harald Fischer, WITec GmbH
For the characterization of the properties of a sample with Raman spectroscopy, an ultrasensitive confocal Raman microscope allows the acquisition of a Raman image stack revealing 3-D information on the distribution of the chemical compounds.

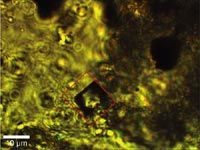
Figure 1a: Video image of the diamond inclusion indicating the scan range for the Raman image.
By integrating a Raman spectrometer within a state-of-the-art confocal microscope setup, Raman imaging with a spatial resolution down to 200 nm laterally and 500 nm vertically can be achieved using visible light excitation. Only light from the image focal plane can reach the detector, which strongly increases image contrast and slightly increases resolution. Special filters are used to suppress the reflected laser light while enabling the Raman scattered light to be detected with a spectrometer/CCD camera combination. With this setup, a complete Raman spectrum is acquired at each image pixel, typically taking between 0.7 and 100 ms. The individual spectra are combined to form Raman images consisting of tens of thousands of spectra. From this multispectrum file, an image is generated by integrating over a certain Raman line in all spectra or by evaluating the various peak properties such as peak-width, min/max analysis, or peak position. Due to the confocal arrangement, even depth profiling and 3-D imaging are possible if the sample is transparent. Using such a sensitive setup can also be an advantage when performing measurements on delicate and precious samples requiring the lowest possible levels of excitation power. Time-resolved investigations of fast dynamic processes can also benefit from the ultrafast spectral acquisition times.

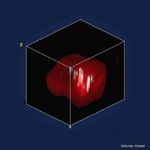
Figure 1b: Three-dimensional reconstruction image of the diamond inclusion in quartz (red: diamond; turquoise: impurities; 13 à 16 à 15 μm, 100 à 100 à 12 pixel, 144,000 Raman spectra); An animated gif can be found at: http://www.witec.de/en/company/witecnews/48/AnimatedDiamond.gif.
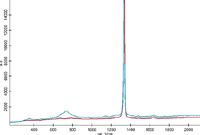
In the following study, a micro-diamond inclusion in quartz was investigated with the WITec alpha300 R in order to capture the 3-D shape of the micro-diamond and to detect impurities. Figure 1a shows a bright field video image of the diamond inclusion (bottom illumination, top view). For 3-D Raman imaging the scan range was 13×16×15 μm consisting of 100×120×12 pixels, resulting in 144,000 Raman spectra. A 100× (NA 0.9) objective was used with an excitation wavelength of 532 nm (600 g/mm grating, 50 μm pinhole). Figure 1b displays the resulting 3-D Raman image of the complete micro-diamond inclusion. The diamond is shown in red whereas the quartz matrix was not considered in the evaluation process and is not shown. Inside the diamond inclusion, one can identify various regions with impurities shown in turquoise (size range: submicron to several microns). The corresponding Raman spectra are shown in Figure 1c (same color coding) clearly revealing the peak of the contamination near 730 1/cm. For a rotating animated gif-file of the inclusion please visit: http://www.witec.de/en/company/witecnews/48/AnimatedDiamond.gif

Figure 1c: Corresponding spectra (red: diamond, turquoise: contaminants).

WITec GmbH
Lise-Meitner-Str. 6, 89081 Ulm, Germany
tel. + 49 (0) 731 140 700; fax + 49 (0) 731 140 70 200
Website: www.witec.de

AI-Powered SERS Spectroscopy Breakthrough Boosts Safety of Medicinal Food Products
April 16th 2025A new deep learning-enhanced spectroscopic platform—SERSome—developed by researchers in China and Finland, identifies medicinal and edible homologs (MEHs) with 98% accuracy. This innovation could revolutionize safety and quality control in the growing MEH market.
Nanometer-Scale Studies Using Tip Enhanced Raman Spectroscopy
February 8th 2013Volker Deckert, the winner of the 2013 Charles Mann Award, is advancing the use of tip enhanced Raman spectroscopy (TERS) to push the lateral resolution of vibrational spectroscopy well below the Abbe limit, to achieve single-molecule sensitivity. Because the tip can be moved with sub-nanometer precision, structural information with unmatched spatial resolution can be achieved without the need of specific labels.
New Raman Spectroscopy Method Enhances Real-Time Monitoring Across Fermentation Processes
April 15th 2025Researchers at Delft University of Technology have developed a novel method using single compound spectra to enhance the transferability and accuracy of Raman spectroscopy models for real-time fermentation monitoring.
AI-Driven Raman Spectroscopy Paves the Way for Precision Cancer Immunotherapy
April 15th 2025Researchers are using AI-enabled Raman spectroscopy to enhance the development, administration, and response prediction of cancer immunotherapies. This innovative, label-free method provides detailed insights into tumor-immune microenvironments, aiming to optimize personalized immunotherapy and other treatment strategies and improve patient outcomes.