The Orbis Micro-XRF Analyzer Series
Building on more than 10 years of Micro-XRF experience, the Orbis spectrometer yields a system with excellent Micro-XRF capability while setting a new standard in analytical flexibility.
Bruce Scruggs, Ph.D., Ametek EDAX
Building on more than 10 years of Micro-XRF experience, the Orbis spectrometer yields a system with excellent Micro-XRF capability while setting a new standard in analytical flexibility. The Orbis incorporates a unique motorized turret integrating video and X-ray optics allowing coaxial sample view and X-ray analysis. The turret can accommodate two additional collimators along with the X-ray optic for a total of three X-ray beam sizes to expand the Orbis analytical capabilities beyond traditional Micro-XRF analysis. Primary beam filters can be used with all spot sizes available on the turret to allow true XRF analytical capabilities in a micro-spot analysis. The working distance is increased to allow analysis over rougher sample topography without sacrificing signal intensity.
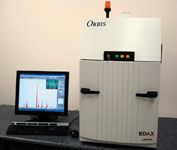
The Orbis is a tabletop unit with powerful, easy-to-use analysis software. Orbis users can make elemental analyses on small samples such as particles, fragments and inclusions, or automated multi-point and elemental imaging analysis on larger samples with all the benefits and simplicity of an XRF analyzer. Benefits include:
- Non-destructive measurement
- Minimal sample preparation (e.g. no sample coating is necessary)
- Improved sensitivity for many elements in comparison to SEM/EDS
- Inclusion and coating thickness analysis with the penetrating power of X-rays
- Analysis of wet samples
Small Spot Analysis
Small spot XRF analysis is typically used for analysis of fragments, targeted analysis on larger components and high-resolution elemental imaging. The Orbis system can be equipped with a 30 μm ultra high intensity poly-capillary capable of providing fast, sensitive XRF analysis. Glass fragments are typically analyzed by micro-XRF for criminal and industrial forensic applications. With the Orbis' poly-capillary and primary beam filter system, fast, non-destructive analysis can be done with improved sensitivity at a spot size of 30 to 60 μm (FWHM) depending on the elemental X-ray energy.
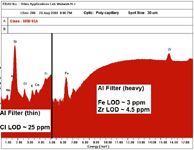
Figure 1: Orbis XRF spectrum (logarithmic intensity scale) of SRM 93A glass using 2 primary beam filters.
In Figure 1, analysis of glass using the 30 μm poly-capillary and primary beam filters for comparative purposes and compositional analysis is shown. Analysis of Cl down to an LOD ~ 25 ppm was achieved using a filter to remove the overlapping Rh(L) tube scatter line.

Figure 2: (above) Orbis montage video composite of mapped ares (27.5 mm à 16.5 mm) on faded black/white photo. The image is of a horse-drawn wagon on a city street. (below) Ag(L) elemental image of photo using 30 μm poly-capillary at approximately 250 DPI pixel density.
In another example (see Figure 2), the Orbis poly-capillary is used to elementally image a portion of a fading black and white photo using the Ag(L) signal to digitize the image. This was done as part of an initial effort to evaluate the suitability of micro-XRF imaging for the archival preservation of Ag-based photos.
Large Spot Analysis
In a variety of analytical scenarios, XRF analysis using a larger analytical beam diameter is more advantageous than probing the sample with a small beam analysis. Analyzing inhomogeneous materials, for example, with a small probe beam yields information on the level of inhomogeneity of the material while analyzing with a large beam can give a compositional analysis more consistent with the average composition. A larger analytical beam is also useful for screening and searching large areas of a sample for specific elements. Good examples of this come from RoHS analysis and screening.
Plastic components used in electronic products are typically screened for the RoHS hazardous elements and compounds (Cd, Pb, Hg, Cr+6, certain Brominated fire retardants) using XRF. Plastics can be relatively inhomogeneous materials with respect to additive components. Average compositional analysis of trace elements in plastic is simplified by analyzing the sample with a large beam (see Figure 3).
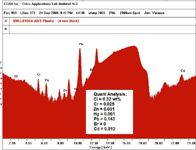
Figure 3: FP 1-standard quantitative analysis of trace elements in a 4 mm thick ABS plastic manufactured as a RoHS standard using a 2 mm X-ray beam diameter.
Using a larger X-ray beam facilitates the speed at which larger multi-component samples can be screened for restricted materials. A typical example is the screening of printed circuit boards for Pb-based solders (see Figure 4). The printed circuit board can be elementally imaged using a larger beam size with lower pixel resolution. Potential problem areas identified by the elemental images can then be analyzed in more detail with a smaller beam size if necessary.

Figure 4: Orbis Pb(L) elemental map of a PCB using a 1 mm collimator. The map indicates the use of Pb-based solder to mount the components on the board.
Conclusion
The Orbis micro-XRF spectrometer was developed with the mindset of providing a state-of-the-art micro-XRF analyzer with excellent analytical flexibility. The goals of the development were to provide the user with:
1) Access to both ultra-high intensity X-ray optics and larger beam collimators
2) Primary beam filters at all spot sizes, small and large
3) Improved elemental sensitivity
With this analytical flexibility, the Orbis system is capable of providing solutions to a wide variety of problems suited to XRF analysis.

EDAX, Inc.
91 McKee Drive
Mahwah, NJ 07430
Tel. (201) 529-4880, Fax (201) 529-3156

New Study Reveals Insights into Phenol’s Behavior in Ice
April 16th 2025A new study published in Spectrochimica Acta Part A by Dominik Heger and colleagues at Masaryk University reveals that phenol's photophysical properties change significantly when frozen, potentially enabling its breakdown by sunlight in icy environments.
Tracking Molecular Transport in Chromatographic Particles with Single-Molecule Fluorescence Imaging
May 18th 2012An interview with Justin Cooper, winner of a 2011 FACSS Innovation Award. Part of a new podcast series presented in collaboration with the Federation of Analytical Chemistry and Spectroscopy Societies (FACSS), in connection with SciX 2012 ? the Great Scientific Exchange, the North American conference (39th Annual) of FACSS.
AI Shakes Up Spectroscopy as New Tools Reveal the Secret Life of Molecules
April 14th 2025A leading-edge review led by researchers at Oak Ridge National Laboratory and MIT explores how artificial intelligence is revolutionizing the study of molecular vibrations and phonon dynamics. From infrared and Raman spectroscopy to neutron and X-ray scattering, AI is transforming how scientists interpret vibrational spectra and predict material behaviors.