Analysis of Air Filters According to EPA Method IO-3.3
The measurement of the elemental composition of suspended particulate matter (SPM) in air is a key factor in understanding the health effects of pollution.
Femke de Beurs, PANalytical Inc.
The measurement of the elemental composition of suspended particulate matter (SPM) in air is a key factor in understanding the health effects of pollution. This application note demonstrates significant detection limit improvement when using the PANalytical Epsilon 5 for the analysis of particulate matter on air filters.
The presence of toxic pollutants in the air has been a subject of research for many years in the United States and countries around the world. In the United States, air quality standards are governed by the "Clean Air Act" and administered by the US Environmental Protection Agency (EPA). One of the key areas of concern for the US EPA is the suspended particulate matter content (SPM) of air. Historically, the measurement of SPM in air was concentrated on total suspended particulates with no preference to size selection. However, more recent research on the health effects of SPM in ambient air has focused increasingly on particles that can be inhaled into the respiratory system, i.e., particles of aerodynamic diameter of <10 μm. These particles are referred to as PM10 (2.5–10 μm) and PM2.5 (< 2.5 μm). Not withstanding chemical toxicity, it is now generally recognized that these particles are a significant threat to health.

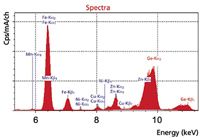
Figure 1: Spectrum of standard NIST 2783.
The measurement of the elemental composition of the particulate matter is a key factor in understanding the long-term health effects of pollution. Suspended particulate matter is typically pre-concentrated using high volume air samplers and collected on Teflon filters. The chemical analysis of the SPM on these air filters is traditionally performed by energy-dispersive XRF (EDXRF) using EPA method 10-3.3. EPA method 10-3.3 outlines the protocol for the analysis of 44 elements on Teflon air filters, but significant advances in the development of EDXRF instrumentation and software have occurred since this method was published. This application study demonstrates the performance of the Epsilon 5 EDXRF analyzer according to the EPA method 10-3.3, with the elemental range extended from 44 to 55 elements.
Measurement Criteria and Calibration
The air filters application used in this study was set up according to EPA method 1O-3.3. The analytical measurement parameters were optimized to accommodate the technological improvements incorporated into the Epsilon 5. The method was calibrated with 59 commercially available air filter standards and a blank sample from Micromatter Co. (Eastsound, WA). The standards were composed of pure elements and compounds deposited on 40 mm Nucleopore media. The calibration was established using a single standard and a blank for each element. A fundamental parameter (FP) method was used to correct for the difference in sample loading when analyzing unknowns.
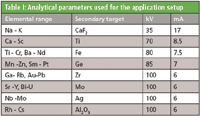
The measurement parameters used for this application are shown in Table I. The measurement time per condition was 100 s, except for the CaF2 target 600 s. The measurement time for each condition can be optimized according to specific needs.

Table I: Analytical parameters used for the application setup
Precision
The total method precision is a combination of instrument precision and stability of the sample during the measurement. The method precision can be reported for both short (repeatability) and long term (reproducibility) measurements. The repeatability of the Epsilon 5 was assessed by measuring a single filter sample (NI5T 2783) 20 consecutive times in a single day. The reproducibility was determined by measuring the same sample once per day over a 10-day period. The repeatability and reproducibility data for a selection of elements are shown in Table II. No drift correct ion was applied during the precision studies. The repeatability and reproducibility are both excellent, and for most elements the short and long term precision are nearly identical. Comparison of the relative RMS values with the counting statistical error (theoretically, the minimum possible error) shows the excellent precision of the instrument and the nondestructive nature of the method for analyzing filter samples.

Table II: Analytical precision for short and long term measurements
Accuracy
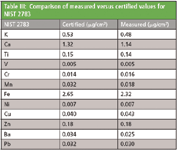
The accuracy of the method was determined by comparing results of the NIST 2783 standard. The results of the selected elements are shown in Table III and show a good agreement with the certified values.

Table III: Comparison of measured versus certified values for NIST 2783
Detection Limits
Detection limits are an important measure of an instrument's performance. The detection limits for this application were calculated from 50 replicate measurements of a Teflon blank sample and are based on 1 sigma (as specified in method 10-3.3). Calculations are based on a measurement time of 400 s per condition, which is chosen to give a better comparison with the values as reported by EPA. The detection limits for 55 elements are shown in Figure 2 and compared with the detection limits as reported by the EPA. Across the majority of the elemental range the detection limits are better or comparable with those quoted by the EPA. The high sensitivity of the Epsilon 5 for measuring elements across the periodic table is a direct result of the combination of the 100 kV dual anode x-ray tube, a wide range of secondary targets and lowered background due to the polarizing geometry of the optical path.

Figure 2: Detection limits (1 sigma) for particulate matter on air filters using the Epsilon 5 compared with those reported by the EPA (reports only elements up to La, except for Pb).
Conclusions
The Epsilon 5 is fully capable of analyzing particulate matter on air filters according to EPA method 1O-3.3 with a high degree of accuracy and precision for a wide range of elements across the periodic table. The nondestructive nature of the method means that it is possible to increase measurement times in case an even higher degree of precision is needed. Furthermore, samples can be measured repeatedly without damage, ensuring the longevity of standards.

PANalytical Inc.
117 Flanders Road, Westborough, MA 01581
tel. (508) 647-1198; fax (508) 647-1115
Website: www.panalytical.com

AI Shakes Up Spectroscopy as New Tools Reveal the Secret Life of Molecules
April 14th 2025A leading-edge review led by researchers at Oak Ridge National Laboratory and MIT explores how artificial intelligence is revolutionizing the study of molecular vibrations and phonon dynamics. From infrared and Raman spectroscopy to neutron and X-ray scattering, AI is transforming how scientists interpret vibrational spectra and predict material behaviors.
Advancing Corrosion Resistance in Additively Manufactured Titanium Alloys Through Heat Treatment
April 7th 2025Researchers have demonstrated that heat treatment significantly enhances the corrosion resistance of additively manufactured TC4 titanium alloy by transforming its microstructure, offering valuable insights for aerospace applications.