Common Problems with FT-IR Instruments and How to Avoid Them
Users of Fourier transform infrared (FT-IR) spectrometers may have received little or no formal training in spectroscopy. Therefore, some users cannot distinguish between “good” and “bad” spectra, which can lead to problems in spectral data processing. Many of the problems that are commonly encountered with the FT-IR spectra measured are easy to avoid if one is aware of the problem. The sources of the problem can be loosely categorized into instrument, accessory, sample, and data processing.
To thoroughly understand the operation of a FT-IR instrument, one needs to realize that the instrument inherently generates a data set that undergoes mathematical transformations, and instrument malfunctions can manifest themselves as spectral features after the transformation. A good example is features that might show up in a spectrum because of environmental vibrations, such as bumping an instrument or having a vacuum pump running on the same bench. By compiling a background with an empty beam and (no accessory or sample) then collecting a sample under the same conditions and ratioing in transmission, this problem can be seen. For a good discussion of the instrument theory and effects, see the literature (1).
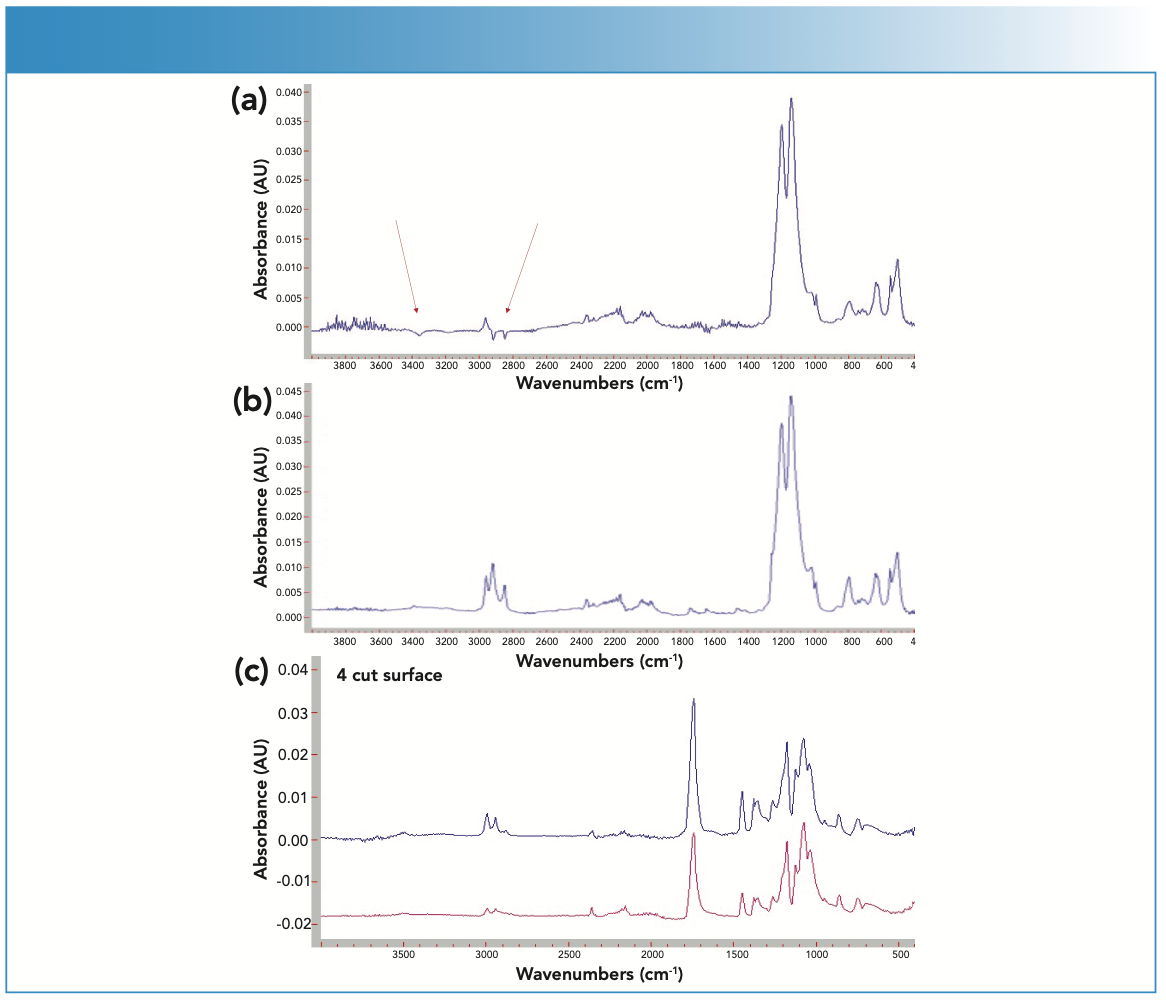
Attenuated total reflection (ATR) is one of the most common and easiest sampling techniques. However, ATR is a technique that can generate false data. ATR interrogates the surface of the sample so that the chemistries on the surface are amplified. One of the most common problems encountered in an FT-IR–ATR analysis is taking the background spectrum with a dirty ATR element. In the spectrum shown in Figure 1a, we see negative features entering the absorbance spectrum, which indicates that the ATR element was not clean when the background was collected. A quick wipe of the ATR element and a new background collection give the actual spectrum of the sample in Figure 1b.
FIGURE 1: (a) Red arrows showing negative features in the absorbance spectrum, indicating that the ATR element was not clean when the background was collected. (b) After cleaning, the ATR element measured a new background collection, and the actual spectrum of the sample shows no negative features. (c) The red spectrum shows the surface of the sample measured as the sample was received. The blue spectrum (top) shows the sample after the outer surface has been cut away and is more representative of the bulk of the sample.

To illustrate the problems that may result from the sample, we can again look at an ATR analysis. Many plastic materials may show different spectra on the surface and slightly into the bulk. Plasticizers can migrate to or away from the surface; the surface may also be oxidized while the bulk represents the actual sample, or there may be some other surface effect because of processing. Figure 1c illustrates this problem. The red spectrum shows the surface of the sample run as the sample was received. The C–H stretch region is fairly weak and the ratios of the peaks on the band envelope at around 1100 cm-1 show different ratios. The blue spectrum on the top shows the sample after the outer surface has been cut away and is more representative of the bulk of the sample.
This surface effect that may appear to be a problem can be used advantageously if you suspect some surface effect either by collecting a spectrum and then cutting into the sample, or making use of the relationship of depth of penetration to the angle of incidence and refractive index of the ATR element. By varying these combinations without violating the critical angle, you can achieve different penetration depths. After an ATR correction to account for the wavelength dependent penetration depth, you can compare surface chemistries. There are two good references to the theory and application of the technique, one by Harrick and the other by Milosevic (2,3).
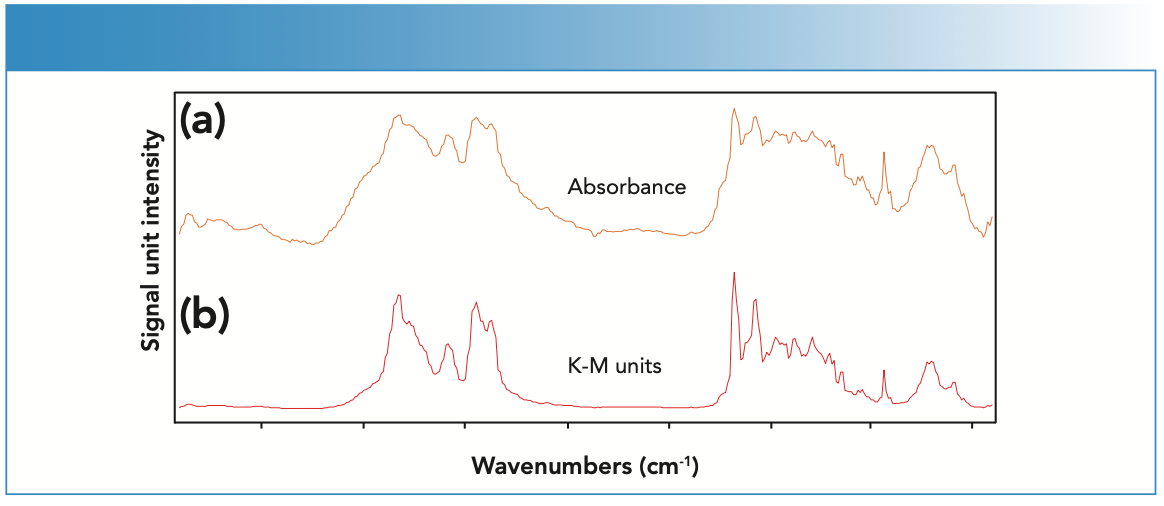
Finally, as mentioned above, the wrong data processing technique can distort the spectrum. A good example is shown in Figure 2. A spectrum collected in diffuse reflection should be ratioed into Kubelka-Munk (K-M) units. In the literature, there is a book chapter written by Griffiths and de Haseth on the topic (4). When the spectrum is ratioed in absorbance (top), the peaks are distorted and appear saturated, and minimal spectral information is available. By calculating the ratio in K-M units, the spectrum now looks normal and can be interpreted.
FIGURE 2: Data processing techniques can distort a diffuse reflection spectrum. (a) When the spectrum is ratioed in absorbance, the peaks are distorted and appear saturated. (b) By calculating the ratio in Kubelka-Munk (K-M) units, the spectrum looks normal and can be interpreted.

As illustrated, there are many sources of problems that can appear. If you understand the implications of the instrument, the accessory, the sample, and the data processing on the final result, you will get a good answer to the analysis question.
References
(1) P.R. Griffiths and J.A. de Haseth, Fourier Transform Infrared Spectrometry (Wiley & Sons, Inc., Hoboken, New Jersey, 2006).
(2) N.J. Harrick, Internal Reflection Spectroscopy, 1st ed. (Wiley Interscience, Hoboken, New Jersey, 1967), pp. 327.
(3) M. Milosevic, Internal Reflection and ATR Spectroscopy (Wiley & Sons, Inc., Hoboken, New Jersey, 2012).
(4) P.R. Griffiths and J.A. de Haseth, in Fourier Transform Infrared Spectrometry (Wiley & Sons, Inc., Hoboken, New Jersey, 2006), pp. 349–362.
Ellen V. Miseo has been involved in spectroscopy and instrument development her entire career. Originally trained as a physical chemist, her primary interest is in new applications of spectroscopic techniques and infrared imaging. She has worked for instrument companies as well as run laboratory operations in both the food and material science areas. Ellen is actively involved in a number of professional societies. She is currently the president of the Coblentz Society and served as the President elect, President, and Past President of the Society for Applied Spectroscopy between 2015 and 2017. Ellen received her PhD from Polytechnic Institute of New York, now part of NYU. Direct correspondence to: ellen.miseo@gmail.com

Jenni Briggs received her Ph.D. from Purdue University. For the past 15 years, she has been working in the field of infrared for the past 15 years and has been with PIKE Technologies for the past 12 years. She specializes in NIR/MIR sampling techniques. Serving as an applications engineer, she assists users choose the best sampling solution for applications.●


New Study Reveals Insights into Phenol’s Behavior in Ice
April 16th 2025A new study published in Spectrochimica Acta Part A by Dominik Heger and colleagues at Masaryk University reveals that phenol's photophysical properties change significantly when frozen, potentially enabling its breakdown by sunlight in icy environments.
AI Shakes Up Spectroscopy as New Tools Reveal the Secret Life of Molecules
April 14th 2025A leading-edge review led by researchers at Oak Ridge National Laboratory and MIT explores how artificial intelligence is revolutionizing the study of molecular vibrations and phonon dynamics. From infrared and Raman spectroscopy to neutron and X-ray scattering, AI is transforming how scientists interpret vibrational spectra and predict material behaviors.
Real-Time Battery Health Tracking Using Fiber-Optic Sensors
April 9th 2025A new study by researchers from Palo Alto Research Center (PARC, a Xerox Company) and LG Chem Power presents a novel method for real-time battery monitoring using embedded fiber-optic sensors. This approach enhances state-of-charge (SOC) and state-of-health (SOH) estimations, potentially improving the efficiency and lifespan of lithium-ion batteries in electric vehicles (xEVs).