Detecting Bacillus Spores by Raman and Surface-Enhanced Raman (SERS) Spectroscopy
Special Issues
Raman spectroscopy has been employed to detect Bacillus cereus spores, an anthrax surrogate, collected from a letter as it passed through a mail sorting system. Raman spectroscopy also has the ability to identify many common substances used as hoaxes. A three-step method also is described for the detection of dipicolinic acid extracted from surface spores by SERS.
Immediately following the September 11, 2001 terrorist attacks, four letters containing anthrax causing spores were mailed through the U.S. postal system infecting 22 individuals, five fatally. The anxiety caused by this bioterrorist attack was exacerbated by the extensive time required for positive identification of the Bacillus anthracis spores and the unknown extent of their distribution along the east coast. The delay in identification was due to the fact that spores had to be germinated and grown in culture media to sufficient cell numbers so that the 16S rRNA gene unique to B. anthracis could be measured. Consequently, the Center for Disease Control and Prevention (CDC) employed a combination of biological analyses of culture grown colonies and polymerase chain reactions to differentiate bacilli from other bacteria and from each other (1,2).
From this bioterrorist attack, it became clear that considerably faster methods of analysis were required. This would expedite assessment of the scale of an attack as well as the extent of facility contamination. This information, in turn, could be used to minimize fatalities, because it was learned that if exposure is detected within the first few days, the majority of victims can be treated successfully using ciprofloxacin, doxycycline, and/or penicillin G procaine (3). However, the challenges of developing such an analyzer are formidable considering that the CDC estimates that inhalation of 10,000 B. anthracis endospores or 100 nanograms will be lethal to 50% of an exposed population (4). An additional challenge has emerged since the 2001 attacks, in that a secondary type of postal-based terrorism has proliferated in the form of hoax letters (5â7). Literally tens of thousands of letters containing harmless powders have been mailed to create additional fear (8). Consequently, an analyzer must not only be able to differentiate B. anthracis spores from other biological materials, but also must be able to identify these harmless powders to eliminate fear and potentially costly shutdowns (9).
In the case of postal-based terrorism, we have been investigating the utility of Raman and surface-enhanced Raman spectroscopy (SERS) to meet the analytical challenges of speed, sensitivity, and selectivity by identifying visible and invisible particles on surfaces, respectively (10â13).
Raman Spectroscopy â Bacilli Spores and Hoax Materials
Raman spectroscopy is attractive because very small samples can be measured without preparation. The sample need only be placed at the focal spot of the excitation laser and measured. Moreover, the rich molecular information provided by Raman spectroscopy usually allows unequivocal identification of chemicals and biochemicals. As early as 1974, the Raman spectrum of
Bacillus megaterium
was measured and shown to be dominated by calcium dipicolinate (CaDPA, 14). This chemical can be used as a signature because only spore forming bacteria contain CaDPA, at ~10% by weight (15â17), and the most common spores, such as pollen and mold spores, do not. The ability of Raman spectroscopy to measure and identify spores is exemplified in Figure 1. Here an ~1-mm
3
spec (~100 µg) of
Bacillus cereus
spores, a nontoxic surrogate for
B. anthracis
spores, was placed on a glass surface, positioned at the focal point of a 1064-nm excitation laser, and measured in 5 min using an FT-Raman spectrometer. Comparison of this spectrum to that for CaDPA shows that the characteristic peaks of the latter at 821, 1014, 1391, 1446, 1573, and 3080 cm
-1
are observed readily in the former. These peaks can be assigned to a CH out-of-plane bend, the symmetric pyridine ring stretch, an OCO symmetric stretch, a symmetric ring CH bend, an asymmetric OCO stretch, and the aromatic CH asymmetric stretch, respectively.
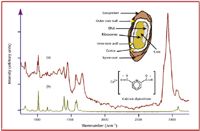
Figure 1. Raman spectra of (a) Bacillus cereus spores and (b) calcium dipicolinate. Conditions: 500 mW of 1064 nm at the sample, 5-min acquisition time.
The B. cereus spore spectrum also contains peaks at 1003, 1241, and 1666 cm-1 that are characteristic of proteins. Specifically, these peaks correspond to the phenylalanine ring breathing mode, and the amide III and amide I stretching modes of peptide linkages, respectively (18,19). The most intense peak at 2935 cm-1 is composed of overlapping, nonspecific organic CH2 and CH3 stretching modes. The relative intensities of the protein bands can be further used to differentiate between bacilli using chemometric approaches (20).
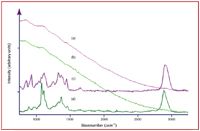
Figure 2. Raman spectra of (a) and (c) flour and (b) and (d) brown envelope paper. Conditions: (a) and (b) 785 nm, (c) and (d) 1064 nm, all 500 mW, 5-min acquisition time.
The same FT-Raman spectrometer was used to measure and differentiate some 100 common powders as potential hoax materials (11). During these measurements, it was found that many common powders, such as coffee creamer and household cleaners, fluoresce at visible laser excitation wavelengths, even at 785 nm. This was true also for both white and brown envelope paper that is found commonly as debris on sorting machines. Fortunately, obscuration of the Raman spectrum by fluorescent emission can be avoided using 1064 nm laser excitation, and high-quality spectra can be obtained in 5 min or less (Figure 2). Once a suspicious powder is measured, a simple chemical identification algorithm can be used to match the sample spectrum one-for-one to a spectrum contained in a library in less than 1 second (21). One of the advantages of Raman spectroscopy is the fact that virtually every chemical produces a unique spectrum, for example, creamer, flour, sugar, and aspirin - the powders most often suspected as B. anthracis spores (Figure 3). It is worth noting that the x-axis invariability of an interferometer-based Raman spectrometer makes such search and match algorithms reliable (22).
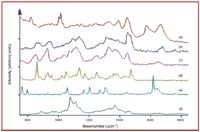
Figure 3. Raman spectra of (a) B. cereus spores, (b) creamer, (c) flour, (d) sugar, (e) aspirin, and (f) paper. Conditions: as in Figure 1. Note that each powder produces a unique set of Raman spectral peaks.
Surface-Enhanced Raman Spectroscopy â Bacilli Spores
Although an analyzer capable of identifying suspicious powders has value, it also is important to be able to measure spores on surfaces to assess the scale of contamination. Such measurements would be useful in establishing the path that a spore-containing letter has taken from destination back to the source, what processing equipment handled the letter, and to what extent individuals may have been exposed or are at risk. These measurements also can be valuable in facility clean-up operations.
Surface-enhanced Raman spectroscopy offers the possibility of detecting just hundreds of spores per square centimeter. SERS involves the formation of a metal surface plasmon field generated by irradiation with light. The efficiency of Raman scattering of a molecule interacting with this field can be enhanced by six orders of magnitude or more. However, strict requirements of metal optical constants, particle size, and irradiation wavelength must be satisfied to generate the plasmon field. Furthermore, the amount of interaction between the metal plasmon field and molecule will influence the amount of enhancement.
For the present application, it has been shown that dipicolinic acid (DPA), the acid form of CaDPA, produces an intense SER spectrum when it interacts with the plasmon field of silver nanoparticles (Figure 4), and it is, therefore, suitable as a signature for bacilli spores (12,13). The SER spectrum of 1 mg/L DPA in water is similar in intensity to the Raman spectrum of a saturated solution of DPA (80 g/L DPA in 1 N KOH). Taking into account sample concentration, laser power, and signal intensity, the ~1000 cm-1 peak intensity is enhanced by 9.3 Ã 105. In addition to the increase in intensity, some of the peaks shift and change intensity due to the molecule to plasmon field interaction. Specifically, the following Raman to SER spectral peak shifts occur: 652 to 657 cm-1, 822 to 812 cm-1, 1001 to 1006 cm-1, 1386 to 1381 cm-1, 1438 to 1426 cm-1, and 1572 to 1567 cm-1.
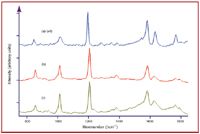
Figure 4. (a) Raman spectrum of 80 g DPA in 1 L 1N KOH in a glass capillary, (b) SER spectrum of 1 mg DPA in 1 L water in a silver-doped sol-gel filled glass capillary, and (c) SER spectrum of ~1 õg of B. cereus spores in a 100-mL drop of DDA collected from 10 cm2 surface. Spectral conditions: (a) 450 mW of 785 nm, 5-min acquisition time, (b) and (c) 150 mW of 785 nm, 1-min acquisition time. Top scale expanded four times.
However, to obtain SERS of DPA, it must be extracted from spores and brought in contact with the plasmon field. Recently, a relatively fast method using hot dodecylamine (DDA) has been developed to break apart spores and release DPA (23). In addition, silver doped in a porous glass structure (sol-gel) has been developed as a SER-active material for chemical separation (24). These developments were combined to perform the following three-step measurement. A 10-µg sample of B. cereus spores was spread over a 10-cm2 glass surface with the aid of methanol and allowed to dry to better mimic a contaminated surface than previous measurements (13, 25). A 100-µL drop of 50 mM DDA in ethanol heated to 78 °C was added to the surface. After 1 min, approximately 10 µL of the solution was drawn into a 1-mm diameter glass capillary containing a 1-cm plug of silver-doped sol-gel. The SER spectrum of DPA collected in the SER-active capillary was then measured using a Raman spectrometer. Figure 4c shows a representative spectrum from one of these capillaries using 150 mW of 785 nm laser excitation and a 1-min acquisition time. The primary DPA peaks at 657 cm-1, 812 cm-1, 1006 cm-1, 1381 cm-1, and 1426 cm-1 are observed readily. The DPA signal intensity is similar to the 1-mg/L sample obtained in water, and suggests that 10 ng DPA were collected in the 10-µL sample. Assuming that a spore contains approximately 10% DPA by weight, this sample corresponds to 100 ng of spores, or for the entire 100-µL drop of DDA, 1 µg of spores. This suggests that ~10% of the original sample was collected. This low percentage could be due to inefficient collection of the sample from the surface, incomplete degradation of the spores by DDA, or inefficient transfer of the DPA to the silver particles. Nevertheless, the signal-to-noise ratio (S/N) of 125 for the 1006 cm-1 peak in the SER spectrum suggests a limit of detection (defined as S/N = 3) of approximately 25 ng of B. cereus spores (2500 spores) in 100 µL DDA.
Improvements in sample collection and/or transfer should allow detection of spores in the hundreds-per-square-centimeter range. Finally, it is worth noting that the sol-gel appeared to have the desired effect of excluding other bacterial cell material from reaching the silver and interfering with the measurement.
Summary
Anthrax remains the highest ranked biological threat agent along with plague (
Yersinia pestis
, 26), and the need to develop analyzers that detect and measure these bioagents to minimize their potential harm remains. Various analyzers are required to address different aspects of a biological attack ranging from detection to treatment. Here, we described two analyzers designed for two aspects associated with anthrax-based postal-terrorism. The first analyzer, a portable FT-Raman spectrometer, was used to provide a complete answer to the identity of suspicious powders that might be found on mail-sorting equipment. Raman spectroscopy can determine if a suspicious powder is a bacilli spore or one of 100 common substances used as hoaxes. We also demonstrated that longer laser excitation wavelengths, such as 1064 nm, are necessary to avoid fluorescence interference by some of these common powders, as well as some envelope papers. The second analyzer, a portable FT-Raman spectrometer was used in conjunction with a SER-active sampling device to detect invisible spores on surfaces.
The analysis involved three steps to break apart the spores, collect dipicolinic acid as a signature of bacilli, and measure the SER spectrum. The entire process required just over 2 min, considerably faster than recent reports (25). The single-use, disposable, sol-gel filled capillaries could be used to measure numerous surfaces and map distribution of anthrax endospores in mail distribution facilities or other environments should another verified attack occur.
Acknowledgments
The authors would like to acknowledge the support of the National Science Foundation in development of the analysis of spores and hoax materials (DMI-0349687), Jay Sperry of the University of Rhode Island for providing spores, Chetan Shende for development of the SERS capillaries (DMI-0215819), and the U.S. Army for the development of the analysis method for dipicolinic acid (DAAD13-02-C-0015, Joint Service Agent Water Monitor Program).
Stuart Farquharson is president and CEO, Wayne Smith is vice-president of Raman products, Carl Brouillette is a senior instrument design engineer, and Frank Inscore is a senior Raman applications specialist, all with Real-Time Analyzers, Inc. (Middletown, CT). E-mail: stu@rta.biz.
References
1. Centers for Disease Control and Prevention, American Society for Microbiology, and Association of Public Health Laboratories. Basic diagnostic testing protocols for level A laboratories for the presumptive identification of
Bacillus anthracis
. American Society for Microbiology, Washington, D.C. http://
www.bt.cdc.gov/Agent/Anthrax/Anthracis20010417.pdf
.
2. C.T. Sacchi, A.M. Whitney, L.W. Mayer, R. Morey, A. Steigerwalt, A. Boras, R.S. Weyant, and T. Popovic, Emerg. Infect. Dis., 8, 1117-1123 (2002).
3. D.M. Bell, P.E. Kozarsky, and D. Stephens, Emerg. Infect. Dis. 8, 222-225 (2002).
4. T.V.Ingelsby et al., JAMA 287, 2236-2252 (2002).
5. See for an extensive list of hoaxes compiled by the Associated Press: http://www.anthraxinvestigation.com/ap.html
6. N. Tucker, "Capitol Police Officer Convicted of Staging Anthrax Hoax," Washington Post, November 22, 2002.
7. Staff reporter, "Anthrax hoax rattles Edmonton post office," CBC News, January 3, 2003.
8. Staff reporter, "Post Office Got 20,000 Powder Reports", Associated Press, March 4, 2004.
9. Staff reporter, "World Bank reports further testing of mail finds no anthrax," Associated Press, April 23, 2002.
10. S. Farquharson, L. Grigely, V. Khitrov, W.W. Smith, J.F. Sperry, and G. Fenerty, J. Raman Spectrosc. 35, 82â86 (2004).
11. S. Farquharson and W.W. Smith, SPIE-Int. Soc. Opt. Eng. 5269, 9â15 (2004).
12. S. Farquharson, W.W. Smith, S. Elliott, and J.F. Sperry, SPIE-Int. Soc. Opt. Eng. 3855, 110â116 (1999).
13. S. Farquharson, A. Gift, P. Maksymiuk, and F. Inscore, Appl. Spectrosc. 58, 351-354 (2004).
14. W.H. Woodruff, T.G. Spiro, and C. Gilvarg, Biochem. Biophys. Res. Commun. 58, 197 (1974).
15. F.W. Janssen, A.J. Lund, and L.E. Anderson, Science 127, 26â27 (1958).
16. W.G. Murrell, G.W. Gould, and A. Hurst, Eds., The Bacterial Spore (Acad. Press, 1969), p. 215.
17. K. Ragkousi, P. Eichenberger, C. Van Ooij, and P. Setlow, J. Bacteriol. 185, 2315â2329 (2003).
18. J.G. Grasselli, M.K. Snavely, and B.J. Gulkin, Chemical Applications of Raman Spectroscopy (John Wiley & Sons, Hoboken, NJ, 1981), Chapter 5.
19. J.C. Austin, T. Jordan, and T.G. Spiro, Biomolecular Spectroscopy, Clark and Hester, Eds. (John Wiley & Sons, Hoboken, NJ, 1993), p. 55.
20. P.J. Treado, M.P. Nelson, and S. Vanni, S., "Raman chemical imaging provides rapid and non-invasive chembiothreat detection," Photonics East, Philadelphia, PA, October, 2004.
21. B.K. Lavine, C. Davidson, and A.J. Moores, Vib. Spectrosc. 28, 83â95 (2002).
22. I.R. Lewis, N.W. Daniel Jr., and P.R. Griffiths, Appl. Spectrosc. 51, 1854â1867 (1997).
23. P.M. Pellegrino, N.F. Fell Jr., and J.B. Gillespie, Anal. Chim. Acta. 455, 167â177 (2002).
24. S. Farquharson, and P. Maksymiuk, Appl. Spectrosc. 57, 479â482 (2003).
25. B. Halford, C&EN, 83, 11 (2005).
26. L.D. Rotz, A.S. Khan, S.R. Lillibridge, S.M. Ostroff, and J.M. Hughes, J.M., Emerg. Infect. Dis. 8, 225â230 (2002).
How THz and THz-Raman Spectroscopy Are Used in Drug Safety, Farming, and Mining
May 20th 2025A new review by researchers from IIT Delhi and the University of Queensland highlights how Terahertz (THz) and low-wavenumber Raman (THz-Raman) spectroscopy are advancing quality control and efficiency in pharmaceuticals, agriculture, and mineral industries. These powerful non-invasive tools enable detailed multi-parameter sensing, offering deeper insight at the molecular level.
The Rise of Smart Skin Using AI-Powered SERS Wearable Sensors for Real-Time Health Monitoring
May 5th 2025A new comprehensive review explores how wearable plasmonic sensors using surface-enhanced Raman spectroscopy (SERS) are changing the landscape for non-invasive health monitoring. By combining nanotechnology, AI, and real-time spectroscopy analysis to detect critical biomarkers in human sweat, this integration of nanomaterials, flexible electronics, and AI is changing how we monitor health and disease in real-time.
The Role of LIBS in ChemCam and SuperCam: An Interview with Kelsey Williams, Part III
May 2nd 2025In this extended Q&A interview, we sit down with Kelsey Williams, a postdoctoral researcher at Los Alamos National Laboratory (LANL), who is working on planetary instrumentation using spectroscopic techniques such as laser-induced breakdown spectroscopy (LIBS) and laser ablation molecular isotopic spectrometry (LAMIS). In Part III, Williams goes into detail about ChemCam and SuperCam and how LIBS is used in both these instruments.

.png&w=3840&q=75)

.png&w=3840&q=75)


.png&w=3840&q=75)


.png&w=3840&q=75)


