Raman and EDXRF Chemical Imaging for Formulation Process Development and Quality Control
Special Issues
Compounds of magnesium and calcium are common components of pharmaceutical formulations. Spectroscopic imaging can provide a complete understanding of a formulation. This paper compares two spectral imaging techniques — energy dispersive X-ray fluorescence (EDXRF) microscopy and Raman microscopy.
Dispersion of the API (active pharmaceutical ingredient) and excipients in pharmaceutical formulations (for example, tablets) is of vital importance to the performance of the final drug product. Among other things, the components' particle size, morphology, and distribution can determine correct dosage as well as correct chemical behavior between the components during dissolution following ingestion and also can determine shelf life. It is not typically possible to measure particle size, morphology, and distribution in a formulation via a simple visual inspection because of the lack of contrast in the optical image. By utilizing the hyper-spectral imaging capabilities of Raman and EDXRF (energy dispersive X-ray fluorescence) microscopies the chemical distribution of the components in pharmaceutical formulations can be observed directly. This is because these techniques provide chemical contrast based upon inelastic scattering by molecular vibrational transitions and differences in elemental composition, respectively.
While many types of transitions other than vibrations (magnetic transitions, rotations, transitions between electronic levels) can mediate Raman scattering, it is the study of molecular and crystalline vibrational transitions that has proved most useful for analytical purposes. During the mid-1970s, Michel Delhaye in northern France conceived of and built the first Raman microscope with functionalities including Raman imaging.
X-ray fluorescence first was observed early in the last century by Moseley and widely used thereafter for chemical analysis. A commercially available microscope provides 10 µm spatial resolution by introducing a collimated X-ray beam through a monocapillary.
Raman and EDXRF Microscopy
In a recent study, in collaboration with the Pfizer Process Analytical Support Group at the Sandwich Laboratories in Kent, we have compared the information provided by Raman and EDXRF microscopy; these two techniques provide molecular and elemental images, respectively. Both analytical techniques are used currently in pharmaceutical process development and quality control. Raman microscopy permits molecular maps with very high spatial resolution (better than 1 µm), which reveals particle size and distribution in a formulation.
The EDXRF microscope provides a rapid method to obtain hyperspectral elemental images with 10-µm spatial resolution. For both techniques, little or no sample preparation is required. Magnesium, calcium, and phosphorus are common components of pharmaceutical formulations. Previously, the distribution of one of the excipients, magnesium stearate, which often is added because of its lubricating properties, has proven particularly difficult to study because it is present in low concentration, spreads very finely, and has weak spectral bands in Raman, FT-IR, NIR, and EDXRF spectroscopy. Because magnesium stearate is added to ensure the uniform mixing and dispersion of the particles of the other components, knowledge about its distribution is important.
Raman and XRF chemical maps are acquired by rastering the sample under the exciting beam and collecting spectra at each point. In the Raman system, this method maintains full confocality. Because full spectra are recorded, all information inherent in the data are available for post processing. The simplest method to prepare chemical maps is to bracket peaks of the species of interest and then color-map the intensity at each pixel in the map of those species. This works well as long as each species has a spectral band that does not overlap with bands of other species. The reality is that for complex organic species this requirement often is not met in multifiles of Raman as well as other complex spectra. In such cases, treatment of the spectra with multivariate techniques enables one to quantify the variances of the individual species. In addition, this multivariate approach can also be helpful in EDXRF (even though the spectra are much simpler) because of the possibility that X-ray fluorescence lines of some elements might overlap.
Experimental
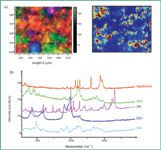
Figure 1a shows first a Raman image (RGB micrograph) of microcrystalline cellulose (MCC), dicalcium phosphate (DCP), and sodium starch glycolate (SSG). This has been produced by bracketing the Raman bands near 850 cm
-1
(SSG), 900 cm
-1
(DCP) and 1100 cm
-1
(MCC). Inspection of the spectra in Figure 1b indicates that these bands exhibit minimum overlap with other species.

Figure 1. (a) Raman maps showing the distribution of the different components in the pharmaceutical formulation. (b) Raman spectra of four excipients plus API.
The second map shown in Figure 1a corresponds to the distribution of magnesium stearate. This map has been produced using full spectra information and multivariate algorithms from ISys™ software (Spectral Dimensions; Olney, MD). In this case the color is used to code for intensity. Careful comparison of the two maps indicates that the magnesium stearate seems to be accumulating at the interfaces between the other particles, which is what one would expect for a lubricant.
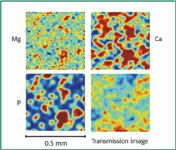
Figure 2 presents the EDXRF maps of magnesium, calcium, and phosphorus elements acquired with the 10-μm capillary. The Ca and P maps are well correlated, which is what one would expect since these two elements occur in the same molecule (dicalcium phosphate). The magnesium stearate is more uniformly distributed than the DCC, showing size domains similar to what was observed in the Raman map. When Mg was mapped with the 100-μm capillary (result not shown here) the distribution was even smoother.

Figure 2. EDXRF map of Mg, Ca, and P and the X-ray transmission image acquired with the 10-μm capillary.
In addition to producing such intensity maps, the software enables statistics to be performed on the multifile, to set thresholds in the maps, and to calculate the percentage of area that is occupied by the species of interest. This capability then allows particle size, morphology and concentrations to be estimated.
Conclusion
In this discussion of an X-ray fluorescence and Raman mapping study of a pharmaceutical formulation we have shown both molecular and elemental compositional maps. These maps provide complementary information at different spatial resolution (1 μm for Raman, 10 μm for XRF), which is helpful in characterizing the effectiveness of particle dispersions in tableting. In particular, the role of magnesium stearate in assisting the mixing can be assessed.
Acknowledgments
The authors wish to thank Fiona Clarke of Pfizer for the samples and valuable discussions and Eunah Lee and Neil Lewis of Spectral Dimensions for help with spectral image processing.
Andrew Whitley, Sergey Mamedov, and Fran Adar are with HORIBA Jobin Yvon (Edison, NJ). E-mail: Andrew.Whitley@JobinYvon.com.

High-Speed Laser MS for Precise, Prep-Free Environmental Particle Tracking
April 21st 2025Scientists at Oak Ridge National Laboratory have demonstrated that a fast, laser-based mass spectrometry method—LA-ICP-TOF-MS—can accurately detect and identify airborne environmental particles, including toxic metal particles like ruthenium, without the need for complex sample preparation. The work offers a breakthrough in rapid, high-resolution analysis of environmental pollutants.
New Study Reveals Insights into Phenol’s Behavior in Ice
April 16th 2025A new study published in Spectrochimica Acta Part A by Dominik Heger and colleagues at Masaryk University reveals that phenol's photophysical properties change significantly when frozen, potentially enabling its breakdown by sunlight in icy environments.
AI-Driven Raman Spectroscopy Paves the Way for Precision Cancer Immunotherapy
April 15th 2025Researchers are using AI-enabled Raman spectroscopy to enhance the development, administration, and response prediction of cancer immunotherapies. This innovative, label-free method provides detailed insights into tumor-immune microenvironments, aiming to optimize personalized immunotherapy and other treatment strategies and improve patient outcomes.