A New Approach to Simultaneous Raman and IR Spectral Searches
Special Issues
A new system for multitechnique spectral searching is described that utilizes analysis of several hit lists resulting from spectral similarity searches performed simultaneously in reference databases for multiple complementary analytical techniques. This paper demonstrates the benefits of this multitechnique approach using the complementary techniques of IR and Raman spectroscopy.
Avariety of complementary spectroscopic and chromatographic techniques are applied to samples in an attempt to address one of two fundamental objectives: compound verification and unknown identification. The former is encountered in environments such as quality control or compound synthesis, the latter in such fields as forensics, competitive product analysis, or natural product identification.
Compound verification and unknown identification have progressed significantly with the advent of computer-searchable electronic databases of reference spectra. Algorithmic comparison of the unknown spectra to those in reference databases can provide strong evidence for the compound's identity, or at least clues that could lead to an ultimate identification or confirmation.
In dealing with the search results of reference spectra and their associated chemical structures in a software-searching environment, three concepts have become traditional to the point of being dogmatic:
Hit Lists. A list of similar spectra is generated by the software program and displayed in a tabular fashion.
Hit Quality Index. A hit quality index (HQI) value is associated with each reference spectrum. The HQI is a numeric representation of the degree of similarity between the unknown spectrum and each reference spectrum. Typically, the higher the HQI value, the more similar the unknown spectrum is to the reference spectrum.
Rank Ordering. The hits are sorted by HQI value. Typically, hits with the highest HQI values are at the top of the list.
A New Approach
Advanced software tools allow a new approach to the problem of compound verification and unknown identification. The new system for multitechnique spectral searching utilizes multi-dimensional analysis of several hit lists resulting from simultaneous spectral similarity searches.
The process is straightforward: multiple spectra from complementary analytical techniques for the same sample are used as unknowns to search multiple reference databases containing spectra from the complementary analytical techniques. Two specific advances, however, transform the traditional hit list approach described earlier into a dynamic and more informative approach for visualizing spectral search results.
The first method is to consider the HQI values from each individual spectral search as values on a coordinate axis. This simple innovation allows the simultaneous display of the relative values of all hits in a hit list.
The second (and far more significant) method is to plot multiple hit lists from multiple spectral searches as points on a scatter plot. Using this approach, each point in the scatter plot represents a single compound where the HQI values for each reference spectrum in each technique are the coordinates in an N-dimensional spectral space. Points that are closer to the origin will have a lower spectral similarity to the unknown than those farthest from the origin.
The complementary nature of Raman and IR spectroscopy is well known and utilized frequently. While both techniques utilize vibrational spectroscopy, the mechanism of Raman scattering differs from infrared absorption. As a result, IR spectra provide information primarily about polar bonds, and Raman spectra provide information primarily about symmetric bonds.
Experimental
This example demonstrates the use of simultaneous combined Raman and IR spectral searches to identify an unknown sample. The procedure is as follows:
- Obtain IR and Raman spectra of the unknown sample;
- Simultaneously search IR and Raman reference database for matches with the unknown spectra;
- Display search results in a hit list sorted by combined HQI (an average or weighted average of the individual IR and Raman HQI values); and
- Display search results graphically using the spectral HQI values for IR and Raman as the x and y coordinate values of a scatter plot.
When examining unknown spectra, a wide range of native analytical file formats can be imported. The search is not dependent upon a particular instrument, vendor, or spectral technique.
In this example, a multitechnique search software system was used to search IR and Raman databases simultaneously for matches to the unknown IR and Raman spectra that were imported into the system. While the search used to create this example was limited to three (two IR and one Raman) spectral databases, any number of databases containing multiple spectral techniques can be searched simultaneously to yield a single result. In this example, one of the specified search options was the "technique must exist for both" requirement. Selecting this option specifies that the combined search must return a pair of IR and Raman spectra linked by an exact chemical structure. This eliminates hits where the IR spectrum exists without the corresponding Raman spectrum and vice versa.
The system automatically removes duplicate spectral hits for the same chemical structure, choosing the database entry with the highest HQI value for each spectral search type. At the end of the search, the entire hit list is transferred automatically to an application with the system for traditional hit list and database visualization and mining.
In this example, each hit list (database) entry comprises both the IR and Raman hits (including individual HQI values), as well as a "combined" HQI calculated by averaging the individual values. By default, the hit list is ordered by combined HQI value, but entries also can be sorted by individual HQI values as well as any other alphanumeric properties from the database.
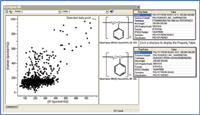
As an entry in the hit list is selected, the application displays the corresponding structure and spectrum and permits simultaneous display of the search and database spectra for comparison. Figures 1a and 1b show the IR and Raman components, respectively, of the hit list entry with the highest combined HQI value. In each case both the search and database spectra are displayed, along with the corresponding structure and properties.

Figure 1. Hit list displays of (a) the IR spectrum and (b) the Raman spectrum. These graphics display unknown IR and Raman spectra searched against spectral reference databases within Bio-Rad's KnowItAllInformatics System.
Next, the entire hit list can be transferred to the system's data plotting application. When data is transferred, a wizard allows selection of which available variables to use as the x and y axes. In this case, the IR and Raman Spectral HQI values are used for the x and y axes. The resulting scatter plot is shown in Figure 2.

Figure 2. Raman and IR HQI scatter plot: In the KnowItAll Informatics System's CompareIt application, the HQI results for Raman and IR spectral searches are plotted against one another. The selected data point in the scatter plot, polystyrene beads, is the correct match for the unknown sample.
Once created, the scatter plot can be manipulated by changing axis variables, and various display elements — axis legends, scatter plot name, colors and fonts — can be customized. It also is possible to use available zoom tools to examine plot areas more closely.
When individual data points are selected, the corresponding database entries are displayed in the main window's structure pane. It is also possible to select several data points on the scatter plot and simultaneously display the corresponding structures. Property information can then be displayed by "mousing over" a structure.
In this example, the single point farthest from the origin has been selected. Because high values represent the best fit for the HQI scale in use, this point represents the best theoretical overall fit considering both the IR and Raman dimensions of spectral space. This data point is, in fact, the correct match for the unknown sample used: polystyrene beads.
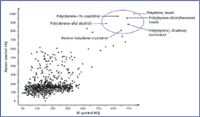
Figure 3 identifies the compounds surrounding the data point representing the unknown (polystyrene beads). The compounds are all similar, and all have high individual and combined HQI values. The use of such a graphical representation allows rapid visual identification of the most likely match as well as a clear visualization of the entire spectral similarity space of the various compounds from the IR and Raman reference databases.

Figure 3. Plotting reveals structurally similar space. Compounds with high HQI values on the scatter plot surrounding the correct match to the unknown (polystyrene beads) are structurally very similar.
Conclusion
New developments in spectral search software have enabled the use of computer-searchable electronic databases of multitechnique reference spectra for compound verification and unknown identification. Multiple spectra from complementary analytical techniques are used as unknowns to search multiple reference databases. Search results then can be visualized by plotting multiple hit lists as points in a scatter plot. This approach has advantages in its ability to use complementary analytical techniques simultaneously, such as IR and Raman spectroscopy, and in the graphic visualization of results with easy access to detailed information for specific data points.
The graphic visualization of multi-technique search results also overcomes the limitations associated with using HQI values generated in a search against a single spectral technique: while the first hit in a ranked one-dimensional hit list is not always the best match, the best hit from a multi-dimensional HQI scatter plot always will have a much higher probability of being the best match.
Beyond the example described here, which uses IR and Raman, other spectral techniques can be applied within the search system and searched in combination against spectral reference databases and then plotted against one another to further verify results.
Gregory M. Banik is general manager, Marie Scandone is database product manager, Rebecca Tuzynski is a technical marketing specialist, and Deborah Kernan is marketing communications manager for Bio-Rad Laboratories, Informatics Division (Philadelphia, PA). E-mail: gregory_banik@bio-rad.com.

High-Speed Laser MS for Precise, Prep-Free Environmental Particle Tracking
April 21st 2025Scientists at Oak Ridge National Laboratory have demonstrated that a fast, laser-based mass spectrometry method—LA-ICP-TOF-MS—can accurately detect and identify airborne environmental particles, including toxic metal particles like ruthenium, without the need for complex sample preparation. The work offers a breakthrough in rapid, high-resolution analysis of environmental pollutants.
New Study Reveals Insights into Phenol’s Behavior in Ice
April 16th 2025A new study published in Spectrochimica Acta Part A by Dominik Heger and colleagues at Masaryk University reveals that phenol's photophysical properties change significantly when frozen, potentially enabling its breakdown by sunlight in icy environments.
AI-Driven Raman Spectroscopy Paves the Way for Precision Cancer Immunotherapy
April 15th 2025Researchers are using AI-enabled Raman spectroscopy to enhance the development, administration, and response prediction of cancer immunotherapies. This innovative, label-free method provides detailed insights into tumor-immune microenvironments, aiming to optimize personalized immunotherapy and other treatment strategies and improve patient outcomes.