Microelectroluminescence Characterization of Single Quantum Dots
Semiconductor quantum dots (QDs) can be used as nonclassical light sources with applications in next-generation quantum communication and computing. Electrically pumped QDs are all solid-state sources of single photons that are not limited by Poisson statistics (1). Recent work by the group of Dieter Bimberg at Technische Universität-Berlin has demonstrated the selective pumping of a single InAs QD with emission from a single exciton (1–3).
Semiconductor quantum dots (QDs) can be used as nonclassical light sources with applications in next-generation quantum communication and computing. Electrically pumped QDs are all solid-state sources of single photons that are not limited by Poisson statistics (1). Recent work by the group of Dieter Bimberg at Technische Universität-Berlin has demonstrated the selective pumping of a single InAs QD with emission from a single exciton (1–3).
Measurement of electro- and photoluminescent signals from nanoscale structures requires both highly sensitive detectors and excellent spectral resolution. Using the Princeton Instruments TriVista triple monochromator and Spec-10 CCD camera, the researchers measured the fine structure splitting of the QD exciton emission line at 952 nm to a resolution of 55 μeV.
Experimental Conditions
The single QD emitter device consisted of a pin diode, where InAs QDs are in contact with p and n-type GaAs junctions. An 850 nm AlGaO current aperture restricted electrical pumping to a single QD (2). The device was maintained at 10 K by an He cryostat. An XY mirror scanner offered precise spatial control. Electroluminescence was induced using 870 pA of current, while photoluminescence was induced by a Nd:YAG laser operating at 532 nm. 10 nW of laser light was focused on the sample to a 1 μm spot with a 100X N.A. 0.9 IR enhanced microscope objective. Light emission was collected and dispersed by a TriVista 500 mm triple monochromator operating in additive mode, with 600 groove/mm gratings in the first two stages and a 1200 groove/mm grating in the final stage, providing a nominal resolution of 0.025 nm per pixel. The detector was an LN cooled Spec10:100 BR CCD camera, with an active area of 1340 × 100 20 μm square pixels. A Hanbury-Brown-Twiss interferometer was coupled to a second exit port of the first stage, allowing the setup to be switched over to perform photon correlation antibunching measurements with a single mouse click.
Results
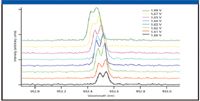
Photoluminescence measurements showed numerous sharp lines in the region between 900 and 960 nm, arising from both excitonic and biexcitonic states of different QDs. In contrast, electrical pumping at currents below 1 nA produced only a single line at 952 nm, with no bulk emission. At higher currents, additional lines assigned to biexcitons and trions appeared. The 952 nm transition was assigned to a single exciton based on the fine structure splitting (FSS). The confinement symmetry causes the excitonic states of these QDs to be split into different levels with orthogonal polarizations parallel to the (110) and (110) crystal planes (3). The FSS was found to be independent of bias voltage over the range tested (Figure 1). The magnitude of the FSS was 55 μeV, corresponding to 0.44 cm–1 or 0.040 nm at the emission wavelength. The spectra shown were obtained with a 1 s acquisition time.

Figure 1: Electroluminescence spectra of a single QD, showing that the fine structure splitting is insensitive to bias voltage.
Conclusions
Normally, a polarizer is used to detect the emission FSS, but the high resolution of the TriVista allowed the FSS to be detected directly. The magnitude of the FSS depends on the size and shape of the QD structures (3). When the FSS is sufficiently small, the exciton and biexciton emission can couple to produce an entangled photon pair source for quantum computing applications (2). These experiments demonstrate the fabrication of a simple, solid-state single-photon or entangled pair emission device with outstanding spectral purity.
Acknowledgments
We thank Erik Stock and Dieter Bimberg for their kind assistance with this note. All data and images are copyright Institute of Semiconductor Physics, TU-Berlin.
References
(1) M. Schotz, et al., Optics Express 15, 9107–9112 (2007).
(2) A. Lochmann, et al., Electron. Lett. 42, 774–775 (2006).
(3) R. Seguin, et al., Phys. Rev. Lett. 95, 257402 (2005).

Princeton Instruments
3660 Quakerbridge Road
Trenton, NJ 08619
Tel: 609.587.9797 | Fax: 609.587.1970

Thermo Fisher Scientists Highlight the Latest Advances in Process Monitoring with Raman Spectroscopy
April 1st 2025In this exclusive Spectroscopy interview, John Richmond and Tom Dearing of Thermo Fisher Scientific discuss the company’s Raman technology and the latest trends for process monitoring across various applications.
A Seamless Trace Elemental Analysis Prescription for Quality Pharmaceuticals
March 31st 2025Quality assurance and quality control (QA/QC) are essential in pharmaceutical manufacturing to ensure compliance with standards like United States Pharmacopoeia <232> and ICH Q3D, as well as FDA regulations. Reliable and user-friendly testing solutions help QA/QC labs deliver precise trace elemental analyses while meeting throughput demands and data security requirements.