Comparing Standard CCD and Electron Multiplication CCD for Low Light Level Spectroscopy
Special Issues
This article compares different CCD platforms by outlining CCD and EMCCD noise sources as well as an explanation of the two calculations to arrive at the signal-to-noise ratio for each. The data presented will show that a liquid nitrogen-cooled CCD camera still is the proper choice for low light level applications, such as Raman spectroscopy.
The evolution of new technologies in scientific charge-coupled device (CCD) detection has brought about the need to compare different CCD types when making such an important and expensive buying decision. This comparison was made using a standard, cooled CCD camera and an electron multiplied CCD camera. Signal-to-noise ratio (S/N) describes the quality of a measurement that can be taken. In CCD spectroscopy, S/N refers to the relative magnitude of the signal compared to the uncertainty in that signal on a per pixel basis. Specifically, it is the ratio of the measured signal to the overall measured noise (frame-to-frame) at that pixel. High S/N is particularly important in applications requiring precise light measurement, such as low light level Raman spectroscopy.
Photons incident on the CCD convert to photoelectrons within the silicon layer. These photoelectrons make up the signal but also carry a statistical variation of fluctuations in the photon arrival rate at a given point. This phenomenon is known as photon shot noise and follows Poisson statistics. Additionally, inherent CCD noise sources create electrons that are indistinguishable from the photoelectrons. When calculating overall S/N, all three noise sources must be understood and need to be taken into consideration. For CCD detection, three sources of noise exist: photon shot nose, dark noise, and readout noise. By comparison, the EMCCD has the same three, but the calculation is different due to the noise factor introduced in the electron multiplication process. The differences in the S/N equations are presented here.
Photon Shot Noise
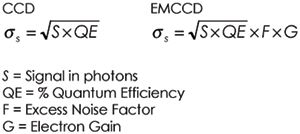
Incoming photons follow Poisson statistics and have an inherent noise, called photon shot nose. This value is the square root of the signal in electrons. For cameras with electron multiplication, the value for photon shot noise is multiplied by the excess noise factor (1.4, for EMCCDS) and the electron gain setting used (adjustable from 1-1000).
Dark Noise
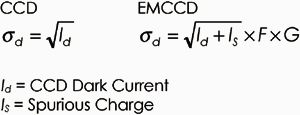
Dark noise is the combination of thermally generated charge, which can be decreased by lowering the temperature of the CCD, and spurious charge, which occurs when electrons are created due to the large inflections of the clock waveform in the multiplication register. It has been estimated that a spurious electron is generated for every 10 pixel transfers; therefore in an EMCCD with 512 pixels, approximately 0.5 e-/pixel/frame can be expected. In the standard CCD, no spurious charge occurs and the total dark noise is defined only by the dark current of the device.
Readout Noise
Readout noise occurs during the process of converting the CCD electrical signal to digital counts, and is not affected by electron multiplication because it occurs after the multiplication process. Read noise is determined by the quality of the camera's electronics and is specified by the manufacturer.
Under low light level conditions, read noise exceeds photon shot noise and the image data is said to be "read-noise limited." The integration time can be increased until photon noise exceeds both read noise and dark noise. At this point, the image data is said to be "photon limited." An alternative means of raising the S/N is to use a technique known as binning. Binning is the process of combining charge from adjacent pixels in a CCD during readout into a single "superpixel." Binning neighboring pixels vertically on the CCD array is a technique used in spectroscopic measurements that allow one to reach a photon-limited signal more quickly and effectively. Once you have determined acceptable values for S/N, integration time, and the degree to which you are prepared to bin pixels, the S/N equation can be solved for the minimum photon flux required. This is, therefore, the lowest light level that can be measured for given experimental conditions and camera specifications.
Signal-to-Noise Ratio
In low light level applications, such as Raman spectroscopy, trying to detect an extremely weak signal is a difficult task if the proper system is not used. The best results will be achieved by increasing the S/N as high as possible. It is important to consider that the signal to be used in the calculation is the signal in photons multiplied by the quantum efficiency of the detector at a given wavelength. In EMCCD operation the QE is reduced due to the excess noise factor, so the effective QE at any wavelength is the actual QE divided by the noise factor. For example, for a back-illuminated CCD, the peak QE is 90% but the effective QE is only 90%/1.4, or 64%. Because the noise factor of a standard CCD is 1, the actual QE is valid for S/N calculations.
Given that the total S/N is the ratio of signal to total noise, which is the square root of the sum of each component squared, the S/N equations for each CCD type can be derived from:
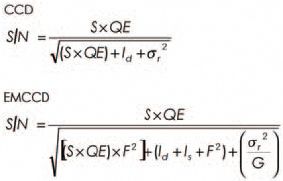
Figure 1 shows the relationship of the S/N of a standard CCD compared to that of an EMCCD for different levels of incident photons. As expected, the S/N increases as the number of photons increase, but the EMCCD never reaches a S/N value greater than 10, where at maximum input of 2000 photons, the CCD achieves a S/N of 44. This assumes maximum electron gain of 1000 for the EMCCD and a longer exposure time for the CCD. Even when the gain of the EMCCD is lowered down to 10 in an effort to decrease the noise factors it introduces, the best S/N that can be achieved is 7.12.
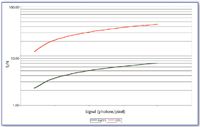
Figure 1. S/N comparison of CCD vs. EMCCD.
Figure 2 shows the relationship between the electron gain and the ratio of CCD S/N to EMCCD S/N. One can see that as the gain is increased, so is the photon shot noise and the dark noise. The standard CCD outperforms the EMCCD by a factor of 62 in the case of maximum gain and by a factor of 6 when a small gain setting of 10 is used. These values were calculated assuming cameras of equal cooling capabilities, so even further improvements can be expected if a liquid nitrogen camera cooled to -120 °C was used.
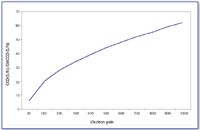
Figure 2. Ratio of CCD S/N to EMCCD S/N at different levels of electron gain.
Conclusion
For low light level applications where real quantitative data needs to be taken, then EMCCD technology does not enhance performance for low light level spectroscopic measurements. Actually, using the increased gain as an alternative to longer exposures just decreases your ability to see your signal above the noise floor. The EMCCD still remains a proper choice for applications requiring video frame rates at full resolution. When considering your camera purchase, you might want to weigh the fact that the extra dollars demanded for the EMCCD does not buy extra performance, when, in fact, a liquid nitrogen cooled CCD camera will do the job much better.
Liquid nitrogen-based cooling reduces the dark current to negligible levels, increasing the sensitivity and S/N by allowing longer integration times that are not feasible with the EMCCD cameras. Usually, liquid nitrogen-cooled cameras serve applications requiring the highest dynamic range, highest sensitivity, and the lowest cooling possible. CCD cameras are available commercially with cooling options ranging from -70 °C to -120 °C. These liquid nitrogen-cooled heads are available with dewar sizes of 1.7 and 2.2 L, with hold times of up to 36 h.
Marc D. Neglia is the product manager for spectroscopy products at Princeton Instruments/Acton (Trenton, NJ). E-mail: mneglia@piacton.com.
Raman Spectroscopy Aflatoxin Detection Enhances Peanut Safety
March 11th 2025A research team from Jiangsu University has developed a Raman spectroscopy-based method to detect aflatoxin B1 (AFB1) in peanuts with improved accuracy and efficiency. By employing a two-step hybrid strategy integrating backward interval partial least squares (BiPLS) and variable combination population analysis (VCPA), the new model significantly enhances the precision of AFB1 detection, providing a more reliable approach for food safety monitoring.
Transforming Connectivity with a Comprehensive Review of IoT Sensors
March 3rd 2025A recent review by researchers at Nagpur University and Seth Kesarimal Porwal College explores the ever advancing landscape of the Internet of Things (IoT) and its essential components—sensors and actuators. The review paper classifies various IoT sensors and examines their role in integrating the physical and digital worlds to enable smarter devices and enhanced automation.
A New Radiation: C.V. Raman and the Dawn of Quantum Spectroscopy, Part I
March 3rd 2025In this "Icons of Spectroscopy" column, executive editor Jerome Workman Jr. delves into Part I of the life and work of C. V. Raman, a physicist who has made major contributions to the science of vibrational spectroscopy and created an understanding for one of the most important quantum-based spectroscopy tools in generations.