Secondary Structure, Stability, and Aggregation Determination of Protein in Solution Using Fourier Transform–Infrared Spectroscopy (FT-IR)
The form and frequency of the amide I band, assigned to the C=O stretching vibration within peptide bonds, is informative and predictive of peptide or protein secondary structure. Fourier-transform infrared (FT-IR) spectroscopy analysis of protein secondary (2°) structure is particularly useful in peptide, protein, or enzyme formulation, widespread in the pharmaceutical and biofuel production industries.
The form and frequency of the amide I band, assigned to the C=O stretching vibration within peptide bonds, is informative and predictive of peptide or protein secondary structure. Fourier-transform infrared (FT-IR) spectroscopy analysis of protein secondary (2°) structure is particularly useful in peptide, protein, or enzyme formulation, widespread in the pharmaceutical and biofuel production industries.
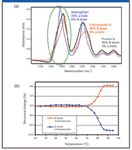
Bruker's Confocheck FT-IR dedicated protein analysis system is used to study protein 2° structure (predict α-helix, β-sheet, and random coil content and changes therein) and protein stability (altered 2° structure in response to stress, i.e., high ionic conditions, pH change, or temperature change) in solution. The 2° structure of a protein is derived by comparing the shape and position of the amide I band of the protein with the shape and position of the amide I band of proteins with known 2° structures derived from X-ray or nuclear magnetic resonance studies. Figure 1a shows the FT-IR absorbance spectra of two proteins, hemoglobin and concanavalin A, that differ greatly in 2° structure. The 2° structure of most proteins is between these two extremes, and the amide I band shape (encircled) would take an intermediate form. So, in practice, there are significant but relatively small differences in the amide I band between proteins. On the basis of these spectral differences, the 2° structure of virtually any protein (example: protein D, Figure 1a) is determined by chemometric methods (e.g. Partial Least Squares).

Figure 1: (a) FT-IR spectra and 2° structure values. (b) Graph of temperature induced structural changes derived from FT-IR spectra.
Subsequent to peptide or protein 2° structure determination, the Confocheck system performs highly sensitive analysis of 2° structure changes that provide a measure of protein stability and aggregation. Generally, peptides and proteins unfold or denature when incubated at higher temperatures. Therefore, rising temperatures can be used to accelerate the denaturation process induced by other effects such as point mutations or formulation changes. Typically in the Confocheck system, the denaturation process is induced by step-wise increases in temperature concurrent with spectrum acquisition. Over the course of temperature rise and peptide/protein denaturation spectra are acquired. The change in shape of the amide I band during the heating process is indicative of loss of α-helices and intramolecular β-sheets and concurrent peptide/protein aggregation due to intermolecular β-sheet formation (Figure 1b). The method is very sensitive, able to identify structural changes of a few percentage points.
Conclusions
The successful analysis of proteins in solution by FT-IR requires a robust system that provides sensitive and reproducible measurements of proteins in solution and the requisite chemometric tools. The Confocheck system satisfies these requirements, thus, enabling the routine use of FT-IR for protein structure and stability analyses for a number of applications. FT-IR analysis of peptide/proteins is used during formulation optimization (example, antibody based therapeutic formulation), thus, expediting the process. Also, peptides/proteins that are expressed in bacterial cells form inclusion bodies with unique 2° structure characteristics (example: enzymes used in the generation of biofuels). FT-IR analysis of inclusion body proteins is used to monitor the protein solubilization and renaturation process.

Bruker Optics
Billerica, MA
1-888-4BRUKER

Thermo Fisher Scientists Highlight the Latest Advances in Process Monitoring with Raman Spectroscopy
April 1st 2025In this exclusive Spectroscopy interview, John Richmond and Tom Dearing of Thermo Fisher Scientific discuss the company’s Raman technology and the latest trends for process monitoring across various applications.
A Seamless Trace Elemental Analysis Prescription for Quality Pharmaceuticals
March 31st 2025Quality assurance and quality control (QA/QC) are essential in pharmaceutical manufacturing to ensure compliance with standards like United States Pharmacopoeia <232> and ICH Q3D, as well as FDA regulations. Reliable and user-friendly testing solutions help QA/QC labs deliver precise trace elemental analyses while meeting throughput demands and data security requirements.