Utilizing Modern Analytical Instrumentation in Brewing Science to Further Quality and Innovation in Beer
At the upcoming SciX 2021 Conference, I will present an experiential workshop that links the sensory analysis of beer and spirits with instrumental analyses. The field of sensory sciences and brewing chemistry is fascinating because in a short period of time, the implementation of analytical instrumentation in one of the oldest industries has opened the doors wide for quality and innovation.
For centuries, beer has been a staple part of consumers’ diets across the globe. Thus, it seems surprising that only recently—meaning in the past few hundred years—has the beer industry been modernized for mass production. Because of this change, the beer industry has had to innovate to ensure that it continues to produce a high-quality product in keeping up with the consumer demand.
Much of the modernization in the field of beer quality and innovation has come through analytical instrumentation. On a practical level, analytical techniques are used to analyze what our anatomical senses perceive while consuming beer. Using such instrumentation allows brewers to make improvements and adjustments to repeatedly target what have been deemed as desirable attributes in beer, and thus, improve the quality of their product. Alternatively, analytical instrumentation can also help brewers and suppliers of brewing materials innovate new products and unlock age-old mysteries of why certain regions tended to make certain styles of beers. As a result, brewers from other regions are now able to recreate the conditions to expand their capabilities and mass produce certain styles of beer that were previously untenable because of their region’s conditions. New instrumentation, therefore, has allowed brewers to increase their versatility, and that has helped them grow their consumer base to compete in the evolving global market.
In food and beverage sensory science, we focus on four senses that our receptors detect: visual, which means the color, hue, and clarity of the beer; mouthfeel, which is the carbonation levels, the thinness or thickness of the beverage, and the temperature of the beer; aroma, which is the odor of the beer and whether it is a hops, malt, or yeast-derived aroma; and taste, whether it is hops, malt, or yeast-derived.
Many brewers and brewing companies are convinced that consumers taste beer with their eyes first. For this reason, brewers have targeted and routinely tested specific colors, hues, and turbidity levels in their beer. Historically, this had been done with swatches of different colors and hues called the standard reference method (SRM), but the analysis was based on discrete color levels, which resulted in a loose specification range. Today, color is typically measured using an ultraviolet-visible (UV-vis) spectrophotometer with the absorbance reading at 430 nm (1). Turbidity is increasingly becoming crucial in what consumers today are voicing as being important to them when selecting beers for purchase and consumption. Two emerging trends are hazy ales and clear lagers, which have determined upper and lower specifications for turbidity. The size of the particulates in finished beer determines the turbidity level. Turbidity is measured using light scattering instrumentation, which measures at two angles, 90° and 13° (2).
The next sense people typically utilize when evaluating a beer is their olfactory senses. There are several organic components in beer that contribute to the aroma of a beer, and there have been a few different instruments that help quantify these compounds. Esters and phenols created by yeast cells during fermentation include isoamyl acetate, ethyl acetate, ethyl hexanoate, and phenylethyl acetate. These esters and phenols can be measured using gas chromatography–mass spectrometry (GC–MS). GC–MS, therefore, can measure the gas in the headspace of a beer (3). Vicinal diketones, such as 2,3-butanedione (diacetyl) and 2,3 pentanedione, are important aromatics to control in beer production and they can be measured using a UV-vis spectrophotometer. Also, aromas derived from the terpene compounds in hops used in beer can be measured using GC–MS (4).
Arguably, the most complex sense used in beer consumption is taste. Taste can be broken into categories, such as saltiness, acidity, bitterness, sweetness, and umami.
Salinity in beer comes from the profile of the water used in the brewing process along with salts that brewers add to adjust the chemistry of the water. Salinity in beer can be measured with a simple conductivity meter.
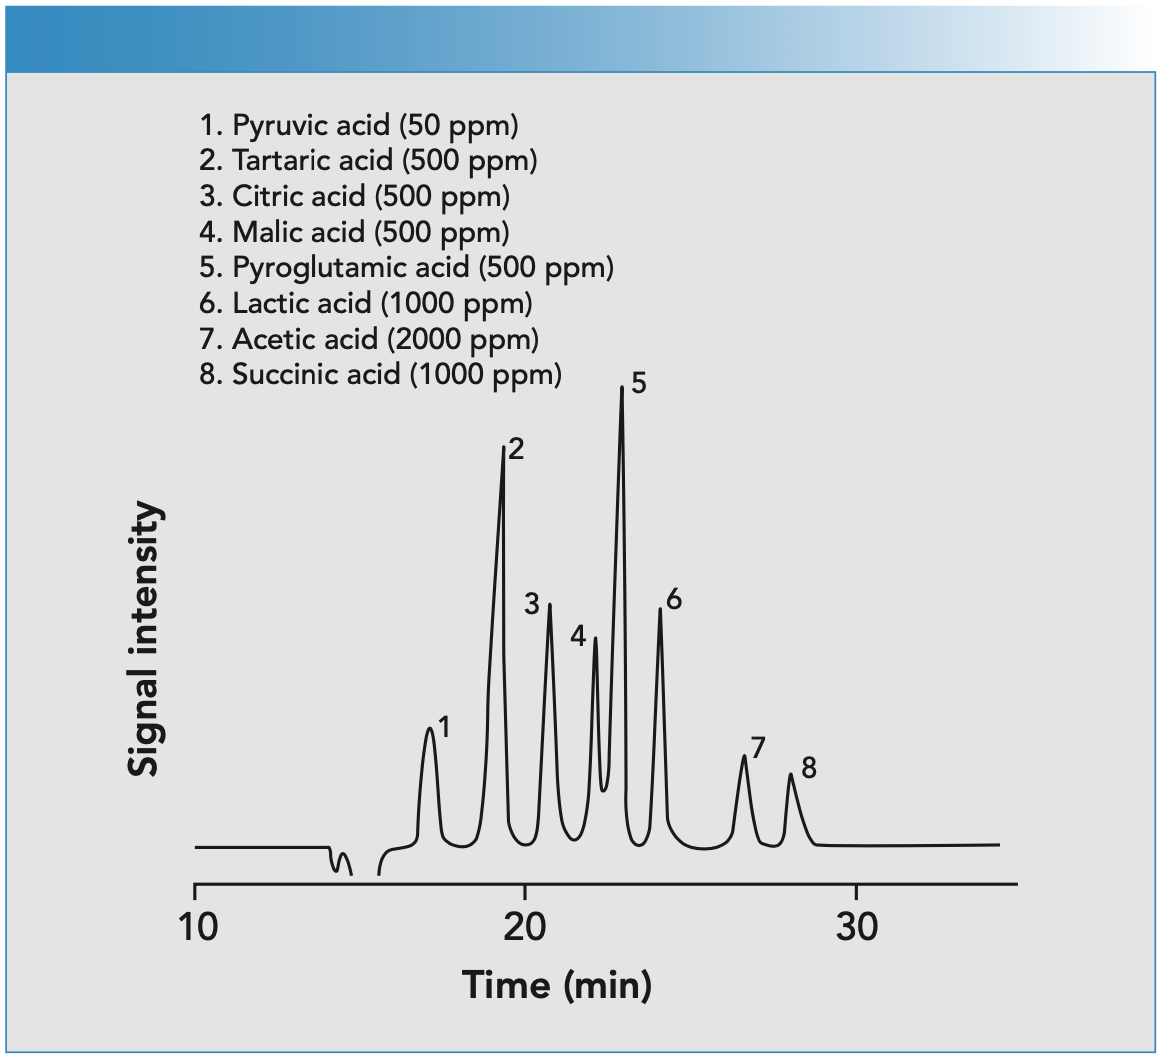
Acidity in beer is measured either simply by using a pH meter or, in the case of heavily soured beers, titratable acidity using a simple wet chemistry titration with the addition of a base and neutral indicator. There are now several handheld titration devices to determine the acid percentage in beer. If one would like a breakdown of which organic acids contribute to the acidity in the beer, a high performance liquid chromatography (HPLC) instrument can be used (5). Figure 1 shows an HPLC chromatogram of the organic acid content in finished beer using perchloric acid as an eluent (mobile phase carrier).
FIGURE 1: HPLC chromatogram of the organic acid content in finished beer using perchloric acid as an eluent (mobile phase carrier).

Bitterness in beer is measured on a scale called international bitterness units (IBUs) and is based around a correlation of quantitative analysis of refraction using a UV-vis spectrophotometer and a historical, qualitative account of brewing scientists’ bitter detection. IBUs can also be measured using GC (6).
Sweetness in beer can be measured in terms of specific gravity using a densitometer. Further analysis of the breakdown of sugar content can be analyzed using HPLC with UV detection (7).
Umami is a fairly new and defined taste element. The glutamic acids in beer are derived from the grains used in the process and can be measured using mass spectrometry (MS).
The final sense discussed in the brewing industry is mouthfeel. This sense is simply defined as the texture of a beer. Carbonation, fullness, and the heat associated with ethanol levels are the three factors contributing to the texture of a beer. Carbonation levels can be measured via dissolved gas meters. Fullness of a beer is associated with the amount of unfermentable sugar in the finished product and can be analyzed with a sugar assay.
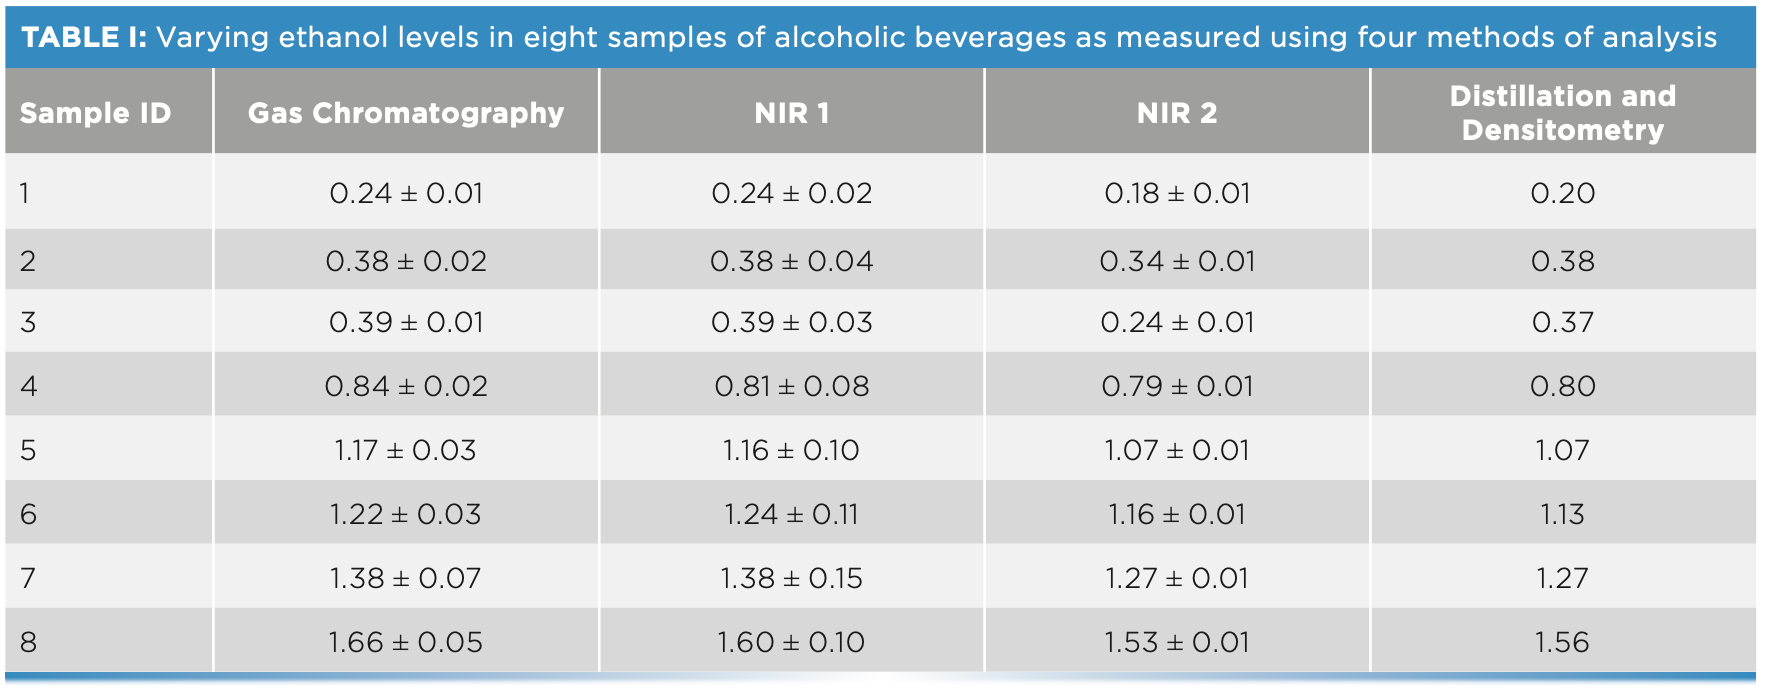
Alcohol content is the most important analysis a brewery can perform, for several reasons. The quality and consistency of beer can be greatly influenced by the presence of alcohol. Brewers also have a great responsibility to public safety to stay as close as possible to the percent alcohol by volume (ABV) they claim on their labels. Beer in the United States is also regulated by the Tax and Tariff Bureau (TTB) for alcohol content, which determines the amount of excise tax a brewer pays. Alcohol content in beer can be measured using a few different methods of analysis. The most traditional is distillation and a densitometer to determine the exact amount of ethanol. A few quicker and more modern approaches use GC or an alcohol meter that utilizes near-infrared (NIR) spectroscopy to measure absorbance. Table I shows the results of testing the alcohol level of eight beer samples, using several different analytical methods: GC, an ethanol sensor (OptiEnz Sensor, NIR 1), a second ethanol sensor (Anton-Paar Alcolyzer, NIR 2), and distillation and densitometry. OptiEnz Sensors continuously and in-line measure specific organic compounds in a solution; in this case, they measure ethanol in beer by utilizing enzymatic sensor tips. Anton Paar utilizes NIR technology to out-line measure ethanol in a solution by differentiating the water and ethanol contents in the solution based on their markers on the NIR spectrum. As can be seen in the table, the results vary.

Although the results vary, they can serve different purposes to the brewer. The in-line and continuous instruments may have a higher variability but allow the brewer to monitor ethanol development throughout fermentation. The out-line instruments have varying degrees of accuracy but also have other factors associate with them to be considered, such as the cost of the instrument, the duration of assay, the degree of difficulty of use, and the consumable cost and sample size. It is up to the brewer to choose the instrument that best suits their needs.
The instruments discussed here cover only a small portion of the analytical equipment and techniques used in the production of beer across the supply chain. Various analytical techniques are used by suppliers of brewing materials, such as malt, hops, and yeast, as well as the municipal water source. Regulatory scientists that measure effluent wastewater from a brewery also use an array of analytical techniques to determine compliance with mandates.
References
(1) American Society of Brewing Chemists, “Beer 10-C Tristimulus Analysis,” in ASBC Methods of Analysis. https://www.asbcnet.org/methods/pages/default.aspx.
(2) T.M. Morris, J. Inst. Brew. 93, 13–17 (1987).
(3) J.M. Leça, A.C. Pereira, A.C. Vieira, M.S. Reis, and J.C. Marques, Anal. Chim. Acta. 5, 101–110 (2015).
(4) M.R. Nance and W.N. Setzer, J. Brewing and Distilling 2(2), 16–22 (2011).
(5) Shimadzu HPLC Application Report No. 25, C190-E105: “Principles and Applications of the Prominence Organic Acid Analysis System.”
(6) American Society of Brewing Chemists, “Beer 23: Beer Bitterness,” in ASBC Methods of Analysis. https://www.asbcnet.org/methods/pages/default.aspx.
(7) A. Debebe, S. Temesgen, M. Redi-Abshiro, B.S. Chandravanshi, and E. Ele, J. Anal. Methods. Chem. 8, 4010298 (2018).
Benjamin A. Chambers is a brewmaster with Newport Craft Brewing and Distilling Co., in Newport, Rhode Island. Direct correspondence to: bchambers@newportcraft.com.


Smarter Sensors, Cleaner Earth Using AI and IoT for Pollution Monitoring
April 22nd 2025A global research team has detailed how smart sensors, artificial intelligence (AI), machine learning, and Internet of Things (IoT) technologies are transforming the detection and management of environmental pollutants. Their comprehensive review highlights how spectroscopy and sensor networks are now key tools in real-time pollution tracking.
High-Speed Laser MS for Precise, Prep-Free Environmental Particle Tracking
April 21st 2025Scientists at Oak Ridge National Laboratory have demonstrated that a fast, laser-based mass spectrometry method—LA-ICP-TOF-MS—can accurately detect and identify airborne environmental particles, including toxic metal particles like ruthenium, without the need for complex sample preparation. The work offers a breakthrough in rapid, high-resolution analysis of environmental pollutants.
New AI Strategy for Mycotoxin Detection in Cereal Grains
April 21st 2025Researchers from Jiangsu University and Zhejiang University of Water Resources and Electric Power have developed a transfer learning approach that significantly enhances the accuracy and adaptability of NIR spectroscopy models for detecting mycotoxins in cereals.