Measurement of Metabolic Stability Using SIM and Identification of Metabolites by Data-Dependent full-Scan MS-MS and CNL Scanning
Special Issues
In this article, the role of a triple-quadrupole mass spectrometer in performing in vitro studies of compound metabolic stability and identification of Phase I and II metabolites is demonstrated.

In vitro pharmacokinetic data, such as metabolic stability and the identification of formed metabolites have become important tools in early drug discovery (1,2). This information can help medicinal chemists improve on a compound's metabolic stability and also enables them to make predictions for in vivo clearances.
The routes by which drugs can be metabolized or biotransformed include oxidation, reduction, hydrolysis, and conjugation reactions. It is important for medicinal chemists to understand these pathways, as the rate of metabolism of a drug can impact the ultimate pharmacological, pharmacokinetic, and toxicological activities.
The most commonly applied model in the pharmaceutical industry to determine metabolic stability utilizes NADPH-supplemented liver microsomes from various species. However, only certain biotransformations, mainly mediated by the cytochrome P450 enzymes, are characterized by this method. It is well known that certain compounds are not prone to cytochrome P450–mediated metabolism, but to direct conjugation with a sugar, sulfate, or other hydrophilicity-enhancing moieties.
Hepatocytes offer an excellent tool to elucidate metabolic pathways, as they comprise an intact cell system with both cytochrome P450 (Phase I) and conjugation (Phase II) enzymes and their required cofactors. In Johnson & Johnson Pharmaceutical Research and Development, rat hepatocytes are applied in early drug discovery for studying both compound metabolic stability and metabolite formation. The analytical procedure utilizes LC–MS-MS for the study of compound turnover (in vitro half-life and subsequent calculation of physiological relevant hepatic clearance data) and the identification of Phase I and II metabolites.
Goal
This report demonstrates the role of a triple-quadrupole mass spectrometer (Finnigan TSQ Quantum Discovery, Thermo Electron Corporation) in performing in vitro studies of compound metabolic stability and identification of Phase I and II metabolites. For the determination of compound metabolic stability, samples were quantified using SIM and from the metabolic turnover an in vitro half-life was calculated. Full-scan MS-MS data dependent scans were carried out for the identification of Phase I metabolites. For Phase II metabolites, constant neutral loss (CNL) scans followed by data dependent triggered MS-MS analysis were performed for identification and structural elucidation.
Experimental
Rat hepatocyte metabolism: Test compounds (exemplified here with verapamil) were incubated in rat hepatocyte suspension cultures using 24-well high recovery plates, purchased from BD-Gentest (Woburn, Massachusetts). Per well, 1 million viable cells were used in 0.5 mL of incubation medium. For in vitro half-life calculations, incubates contained 5 μM verapamil. Time points were 0, 15, 30, 60, and 120 min and assayed in triplicate. The reactions were stopped with two volumes of dimethyl sulfoxide (DMSO). For metabolite identification, incubations were performed using 50 μM verapamil. The reaction was stopped with two volumes of DMSO after 60 min. For sample preparation, the incubates were centrifuged for 10 min at 4 °C in glass vials (3000g) and the supernatants were transferred to 96-well plates for analysis by LC–MS-MS.
HPLC:
- Column: Hypersil BDS C18, 50 mm X 4.6 mm, 5 μm (Thermo Electron)
- Flow rate: 1.2 mL/min (from which 0.1 μL was split off and infused into the source)
- Mobile phase A: 10 mM ammonium acetate (95%), acetonitrile (5%) pH 7.5
- Mobile phase B: Acetonitrile (100%)
- Injection volume: 50 μL
- Gradient I: Quantitation using SIM, starting with 100% A to 5% A at 2.5 min, hold for 2 min, and return to 100% A in 0.5 min. Total time was 6 min.
- Gradient II: Qualitative metabolite i.d., starting with 100% A, hold for 2 min, to 5% A in 4 min, hold for 5 min, return to 95% A in 1 min. Total time was 12 min.
Mass spectrometry: A Finnigan TSQ Quantum Discovery MS system from Thermo Electron Corporation (San Jose, California) was used to perform the analyses. All analyses were carried out in positive electrospray mode.
ESI conditions: flow inlet, 0.1 mL; spray voltage, 3800 V; sheath gas pressure, 30 l; auxiliary gas pressure, 10; capillary temperature, 370 °C.
Single ion monitoring (SIM): scan time, 0.5 s; scan width, 1 Da; unit resolution (0.7 FWHM).
Full-scan MS-MS data-dependent scans: 320–800 Da in 1 s. Data-dependent scan (MS-MS) of most intense ions above threshold of 105 cps. Collision energy of 35 V and collision gas (Ar) pressure of 1.5 mTorr was used.
CNL scans: for losses of m/z 176 (glucuronic acid adducts), m/z 80 (sulfate) and m/z 129 (glutathione adducts). Scan time was 1 s. The collision energy was 35 V, and the collision gas (Ar) pressure was 1.5 mTorr.
Determination of in vitro metabolic turnover and calculation of metabolic half-life: The percentage compound remaining at a certain time, point x, was determined by comparing the peak areas (measured in SIM) of the parent compound at Tx with that at T0 min and was calculated as follows:
- % remaining = [area at Tx/average areas T0] 100%;
- % metabolized = [100 – % remaining]
(the averaged areas of the
T
0
minute triplicates are used for calculation).
Metabolic in vitro half-lives (t1/2) were calculated using the slope of the log-linear regression from the concentration remaining parent compound versus time relationship (k) as reported by Obach and colleagues (3).
t1/2= –ln 2/k.
Results
Determination of the verapamil in vitro half-life: The determination of the metabolic in vitro half-life of verapamil from the log-linear curve of the verapamil turnover is graphically outlined in Figure 1. The calculated in vitro t1/2 was 20 min.
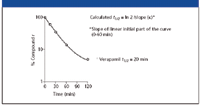
Figure 1: Log-linear curve of verapamil turnover with rat hepatocytes.
Phase I metabolite identification: Several metabolites were detected in full-scan mode, however we exemplify with a major M-14 and a minor M-28 metabolite. The extracted ion chromatogram of verapamil and the corresponding M-14 and M-28 metabolites are illustrated in Figures 2a–c.
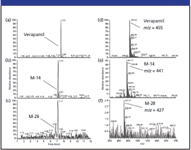
Figure 2: Extracted ion chromatograms of (a) verapamil, (b) a M-14 metabolite, (c) a M-28 metabolite and the corresponding full-scan spectra of (d) verapamil, (e) the M-14 metabolite, and (f) the M-28 metabolite, respectively, formed with rat hepatocytes.
Verapamil is observed to be eluted at 7.57 min, with the major M-14 metabolite at 7.15 min, and the minor M-28 at 6.76 min. The corresponding full-scan mass spectra of these three components are illustrated in Figures 2d–f. As is evident from these full-scan mass spectra, it is possible to determine the molecular weight but not a great deal of structural information. However, the data dependent full-scan MS-MS spectra shown in Figures 3a and b are more information rich, allowing a prediction of the structure for the M-14 metabolite.
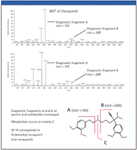
Figure 3: MS-MS spectra of (a) verapamil and (b) a major M-14 metabolite obtained by data-dependent full-scan MS-MS for proposal of Phase I metabolite structure.
Phase II metabolite identification: Phase II reactions in drug metabolism are classified as conjugation reactions and give products that in most cases account for the majority of the inactive, excreted products of a drug. Examples include glucuronidation, glycosidation, and sulfation.
Figures 4a and b show the full-scan extracted ion chromatograms of the M-14 metabolite glucuronic acid conjugate (at 5.49 min) and the M-28 metabolite glucuronic acid conjugate (at 5.25 min), with their respective mass spectra in Figures 4c and d.
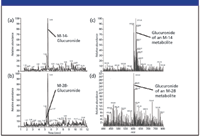
Figure 4: Confirmation of glucuronide formation in full-scan mode: Full-scan ion chromatogram of (a) the M-14 metabolite glucuronic acid conjugate and (b) the M-28 metabolite glucuronic acid conjugate and corresponding full-scan spectra of (c) the M-14 metabolite glucuronic acid conjugate, and (d) the M-28 metabolite glucuronic acid conjugate.
In comparison with Figure 4, the CNL chromatograms (Figures 5a and b) for the same M-14 and M-28 metabolite conjugates are more specific (due to the characteristic loss of 176 mass units), and provide much cleaner mass spectral data (Figures 5c and d). This clearly demonstrates the advantages of using CNL scanning when looking for specific Phase II metabolites such as glucuronide conjugates. The MS-MS spectra of these two particular metabolic conjugates are shown in Figure 6 for structure elucidation. In Figure 6a, the presence of the diagnostic fragments at m/z 165 and m/z 260 (which are characteristic of nor-verapamil, see fragmentation schematics in Figure 3), indicate nor-verapamil glucuronide as the major Phase II metabolite. Added confirmation comes from the m/z 441, which can be assigned to the free M-14 metabolite fragment. Following this rationale, it is suggested that the minor Phase II metabolite eluted at 5.25 min is a bi-demethyl-verapamil glucuronide.
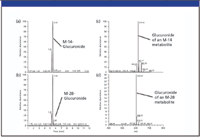
Figure 5: CNL ion chromatograms of (a) the M-14 metabolite glucuronic acid conjugate and (b) the M-28 metabolite glucuronic acid conjugate and CNL spectra of (c) the M-14 metabolite glucuronic acid conjugate, and (d) the M-28 metabolite glucuronic acid conjugate.
A further example of the advantage of CNL scanning over full-scan mode is illustrated by the detection of another Phase II metabolite in Figure 7. This shows the glutathione conjugate of a proprietary drug discovery compound (MW 421 amu, structure not disclosed). Figure 7a shows the ion chromatogram obtained using CNL, and Figure 7b shows the same chromatogram but obtained in full-scan mode. The respective mass spectra, in Figures 7c and d, again clearly highlight the benefit of CNL data for structural elucidation: while the signal-to-noise ratio (S/N) was 2.5 in full-scan, in CNL the S/N was greater than 50.
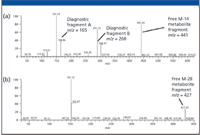
Figure 6: MSâMS spectra of Phase II metabolites for structure elucidation: (a) the M-14 metabolite glucuronic acid conjugate and (b) the M-28 metabolite glucuronic acid conjugate.
Conclusions
The utility of the Finnigan TSQ Quantum Discovery system in early drug discovery for the measurement of a compound's metabolic stability with rat hepatocytes and for the identification of its Phase I and II metabolites has been illustrated.
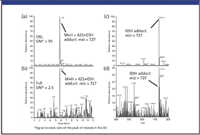
Figure 7: Detection of a glutathion adduct using CNL (129) scan and confirmation with MS full-scan mode: ion chromatogram of the GSH adduct in (a) CNL mode and (b) full-scan mode and the corresponding mass spectra, (c) from CNL mode, and (d) measured in full-scan +4752.
The measurement of the in vitro metabolic turnover in terms of an in vitro half-life was performed using selective ion monitoring.
The identification of Phase I metabolites was facilitated by applying Data Dependent full-scan MS-MS. Phase II metabolites were identified using CNL scanning especially for glucuronides and glutathione conjugates. A significantly better signal-to-noise ratio in CNL as compared with full-scan could be demonstrated. However, using information of the data-dependent full-scan MS-MS also for Phase II metabolite identification in addition to the CNL scanning can give even more structural information on the metabolite and provides an additional confirmation of the proposed metabolite formation.
Peter B. Ehmer, Ethirajulu Kantharaj, Katie De Wagter, Anne Van Vlaslaer, Claire Mackie, and Ron A.H.J. Gilissen are with Johnson & Johnson Pharmaceutical Research & Development, 2340 Beerse, Belgium.
Dipankar Ghosh and Karel Lazou are with Thermo Electron Corporation, San Jose, California.
References
(1) E. Kantharaj, A. Tuytelaars, P.E.A. Proost, Z. Ongel, H.P. Van Assouw, R.A.H.J. Gilissen, Rapid Commun. Mass Spectrom. 17, 2661–2668 (2003).
(2) E. Kantharaj, P.B. Ehmer, K. De Wagter, A. Tuytelaars, P.E. Proost, C. Mackie, R.A. Gilissen, Biomed Chromatogr. In press.
(3) R.S. Obach Drug Metab Dispos. 27, 1350–1359 (1999).

High-Speed Laser MS for Precise, Prep-Free Environmental Particle Tracking
April 21st 2025Scientists at Oak Ridge National Laboratory have demonstrated that a fast, laser-based mass spectrometry method—LA-ICP-TOF-MS—can accurately detect and identify airborne environmental particles, including toxic metal particles like ruthenium, without the need for complex sample preparation. The work offers a breakthrough in rapid, high-resolution analysis of environmental pollutants.